- Home >
- Stock Photos >
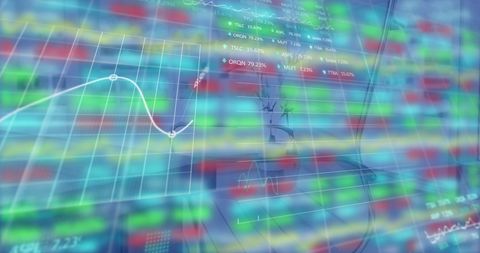
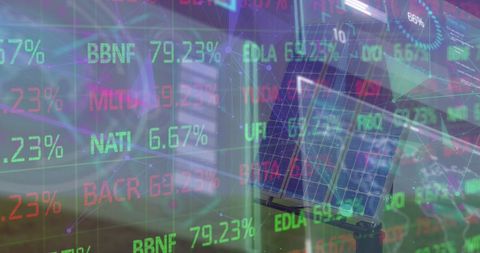
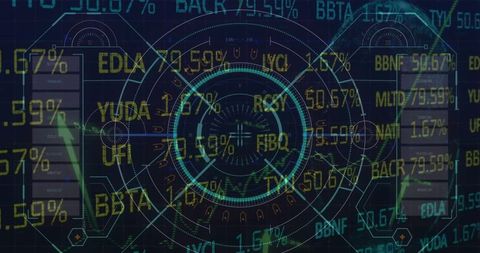
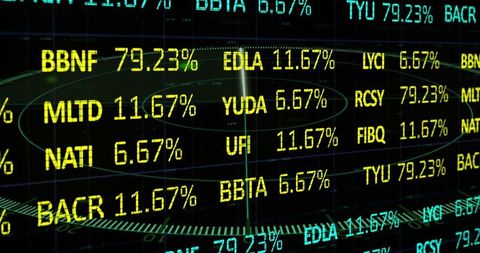
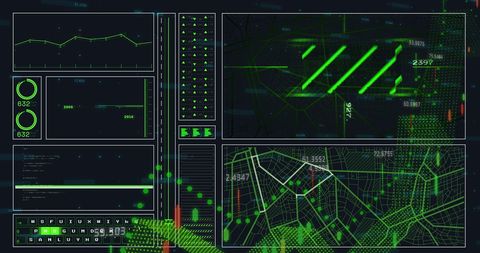
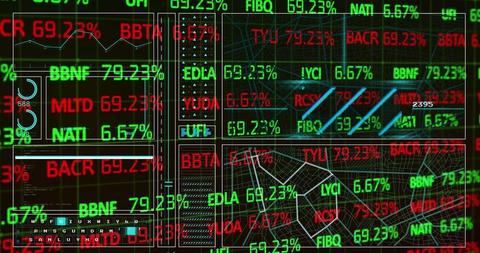
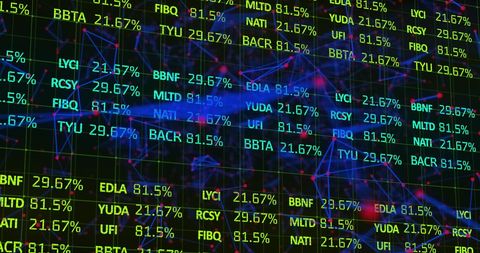
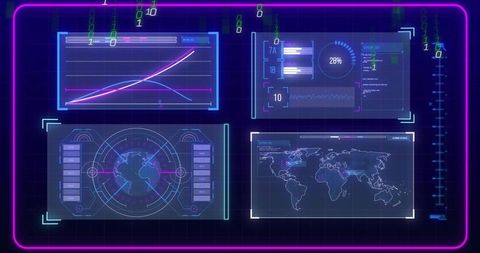
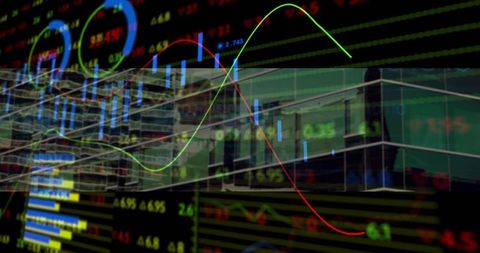
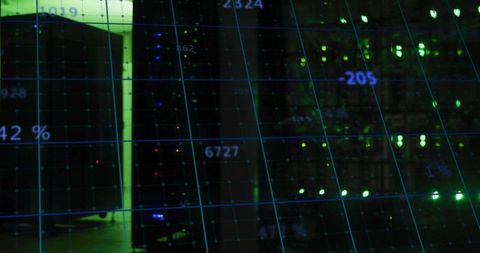
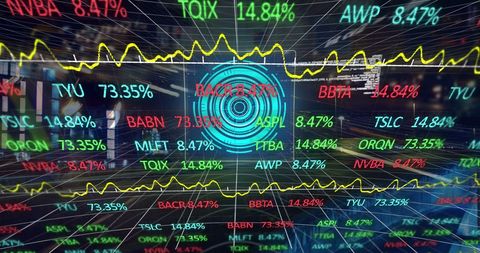
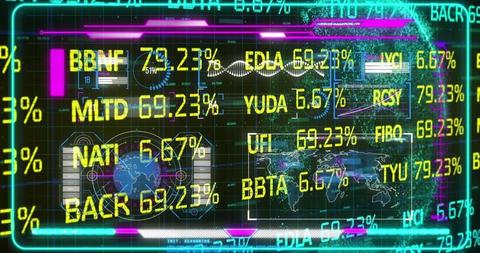
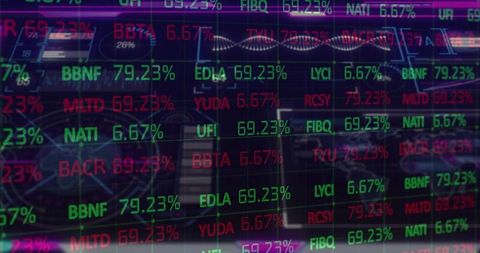
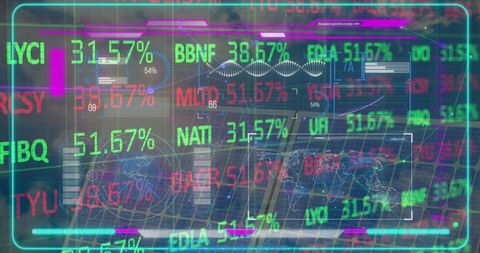
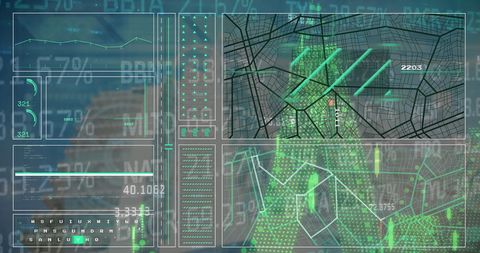
- Futuristic Digital Interface Displaying Financial Data and World Maps
Futuristic Digital Interface Displaying Financial Data and World Maps Image

Futuristic digital interface highlighting financial graphs, data analysis, and global connectivity. Colorful screens and digital elements convey an advanced research and technology concept. Useful for themes in technology promotions, finance articles, and innovation reports.

downloads
Tags:
More
Credit Photo
If you would like to credit the Photo, here are some ways you can do so
Text Link
photo Link
<span class="text-link">
<span>
<a target="_blank" href=https://pikwizard.com/photo/futuristic-digital-interface-displaying-financial-data-and-world-maps/8e86bf063a8b179ec80a7a8f378e7f7b/>PikWizard</a>
</span>
</span>
<span class="image-link">
<span
style="margin: 0 0 20px 0; display: inline-block; vertical-align: middle; width: 100%;"
>
<a
target="_blank"
href="https://pikwizard.com/photo/futuristic-digital-interface-displaying-financial-data-and-world-maps/8e86bf063a8b179ec80a7a8f378e7f7b/"
style="text-decoration: none; font-size: 10px; margin: 0;"
>
<img src="https://pikwizard.com/pw/medium/8e86bf063a8b179ec80a7a8f378e7f7b.jpg" style="margin: 0; width: 100%;" alt="" />
<p style="font-size: 12px; margin: 0;">PikWizard</p>
</a>
</span>
</span>
Free (free of charge)
Free for personal and commercial use.
Author: Creative Art