- Home >
- Stock Photos >
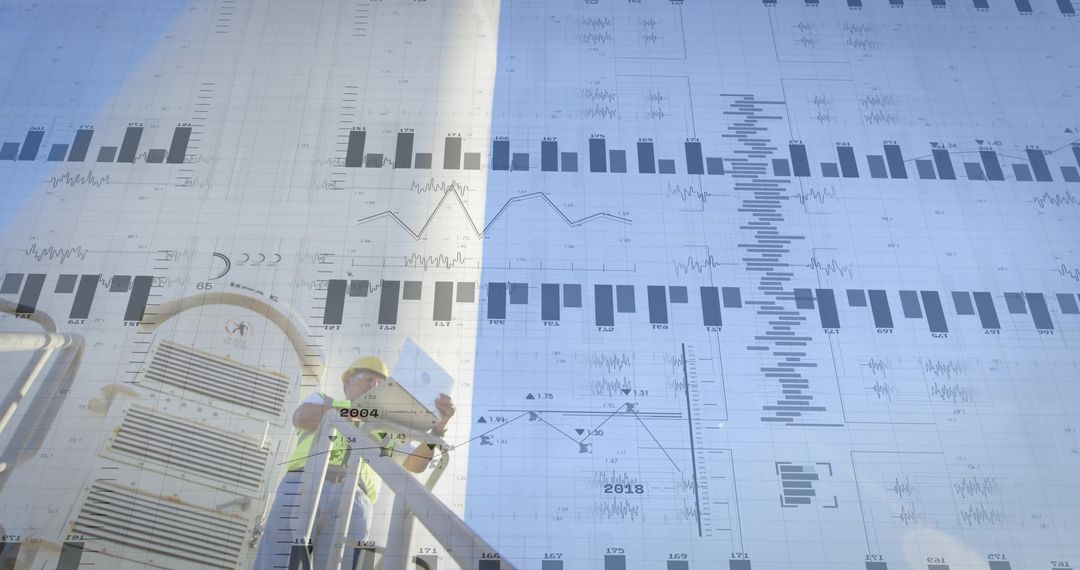
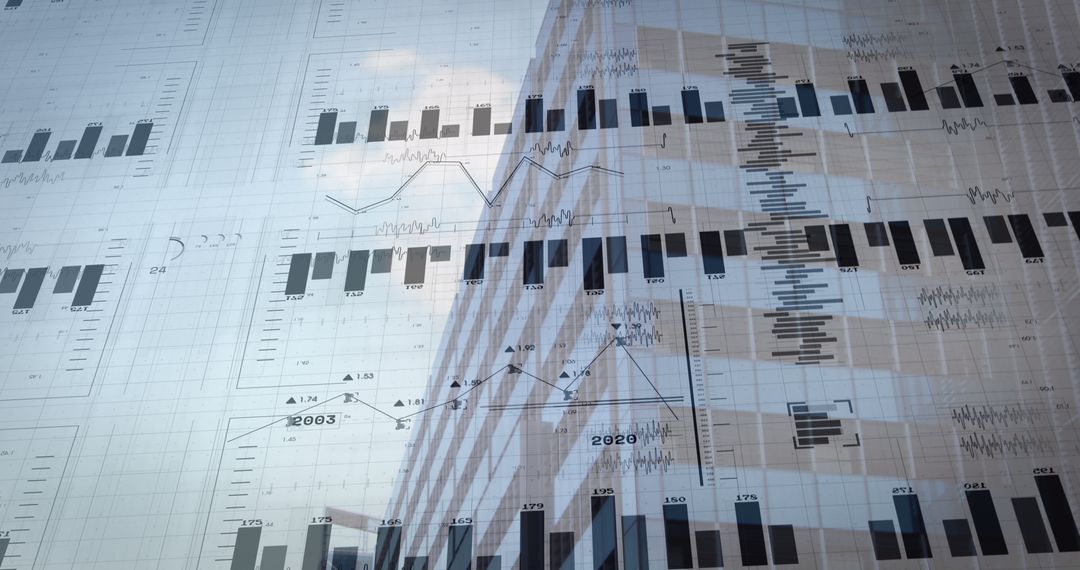
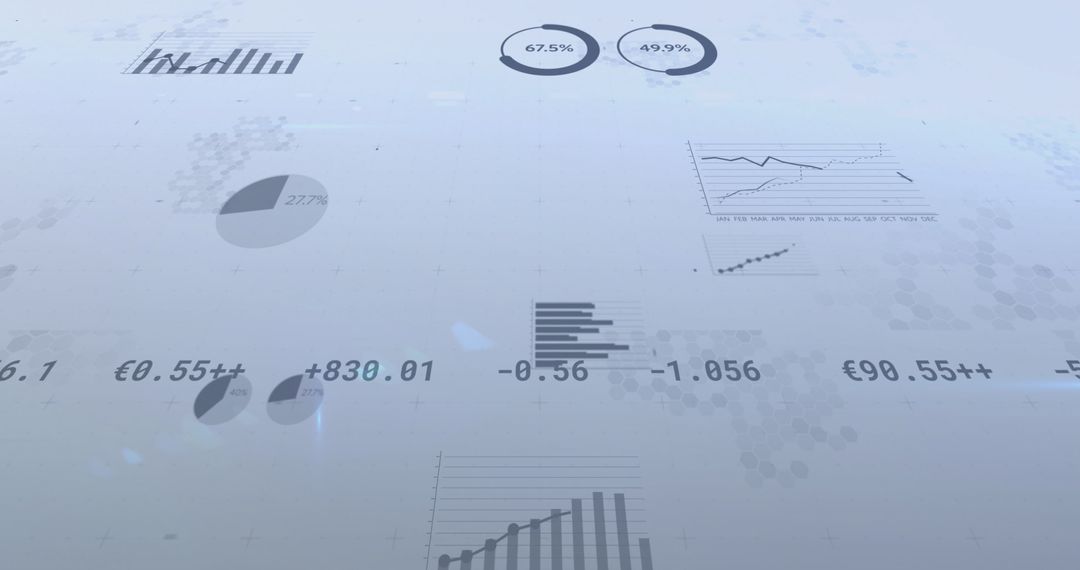
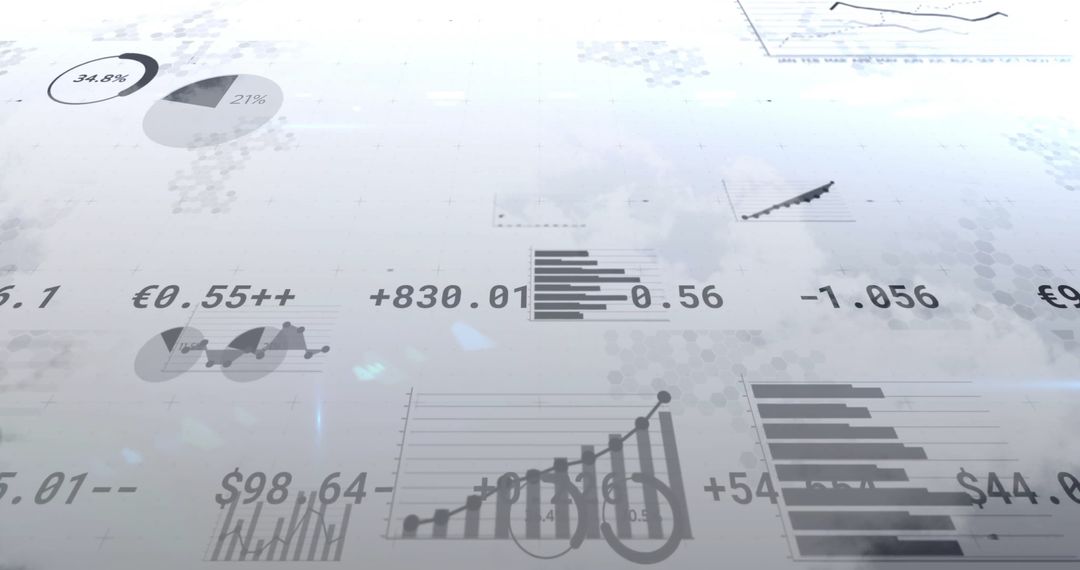
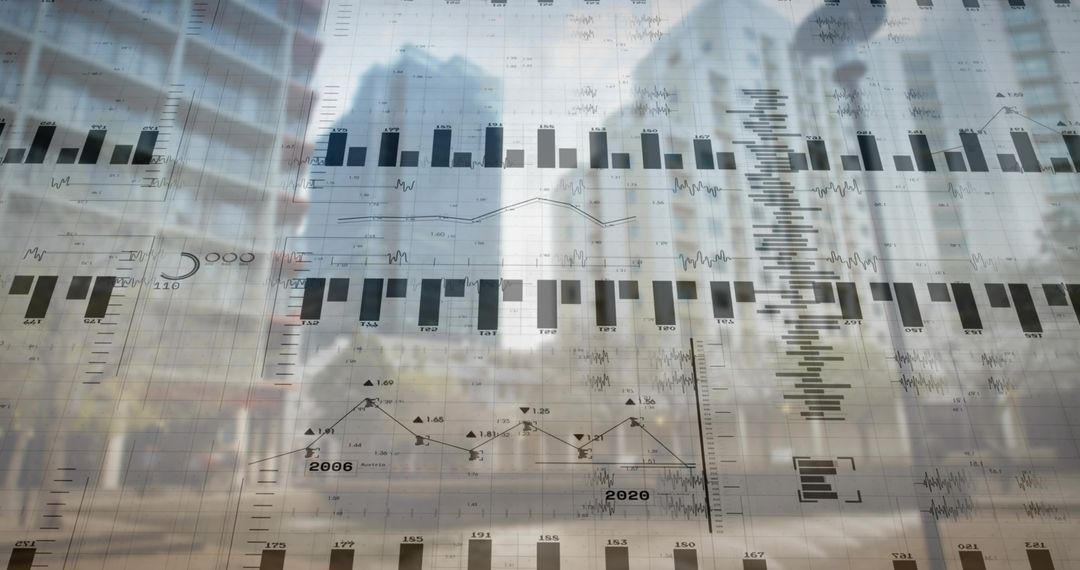
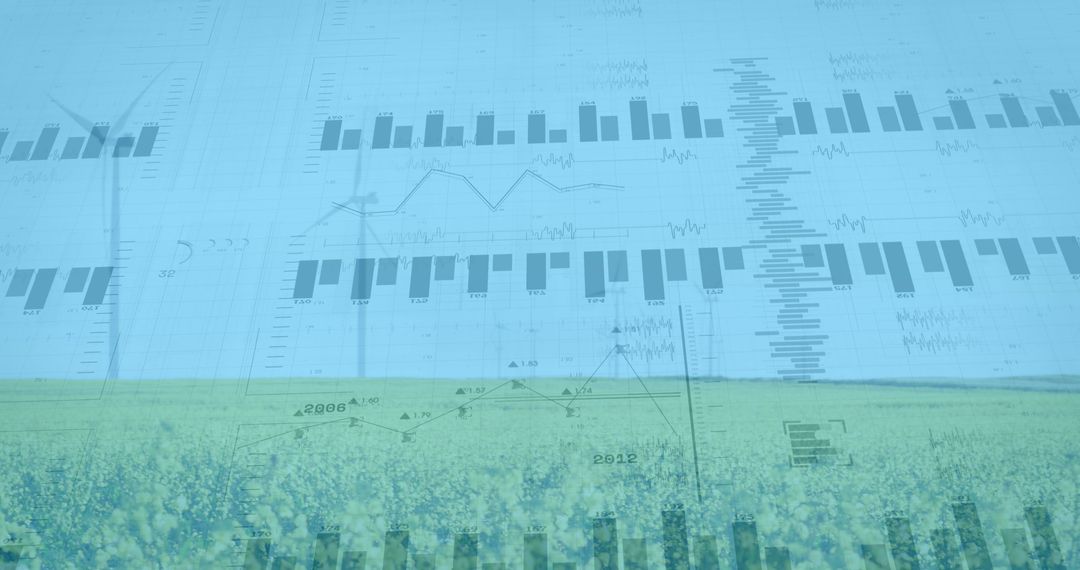
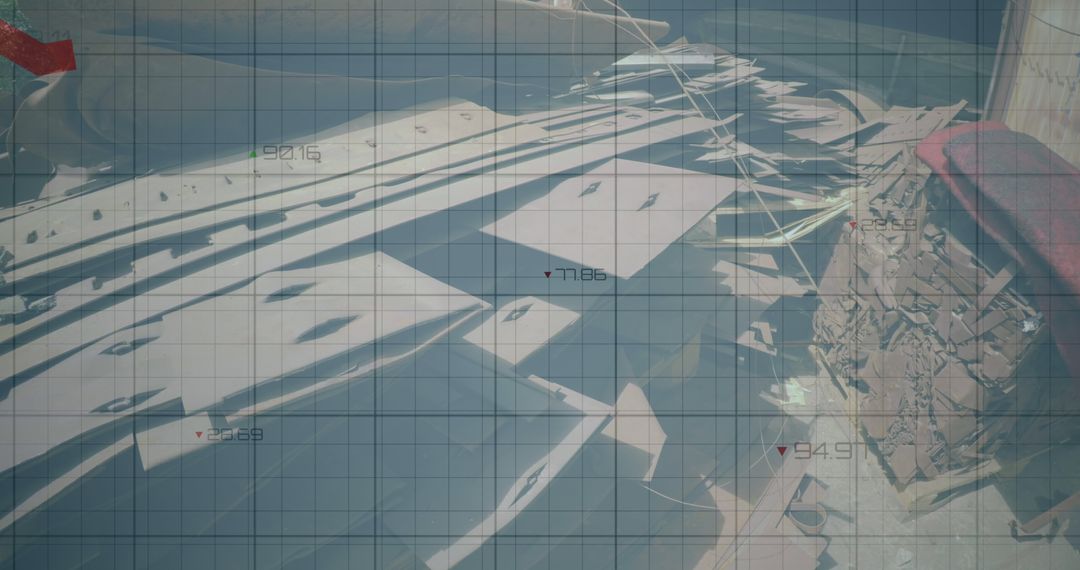
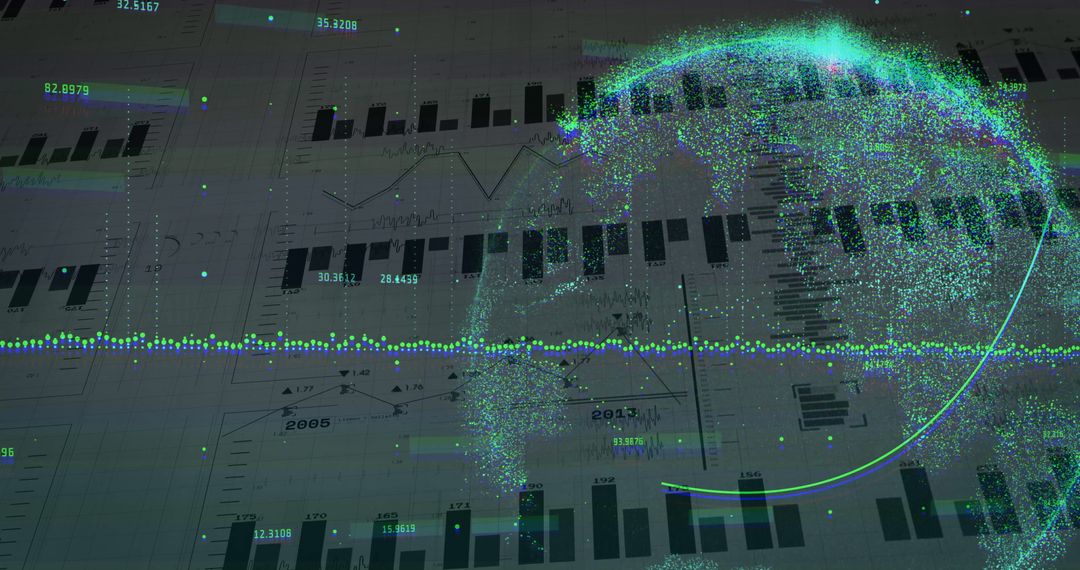
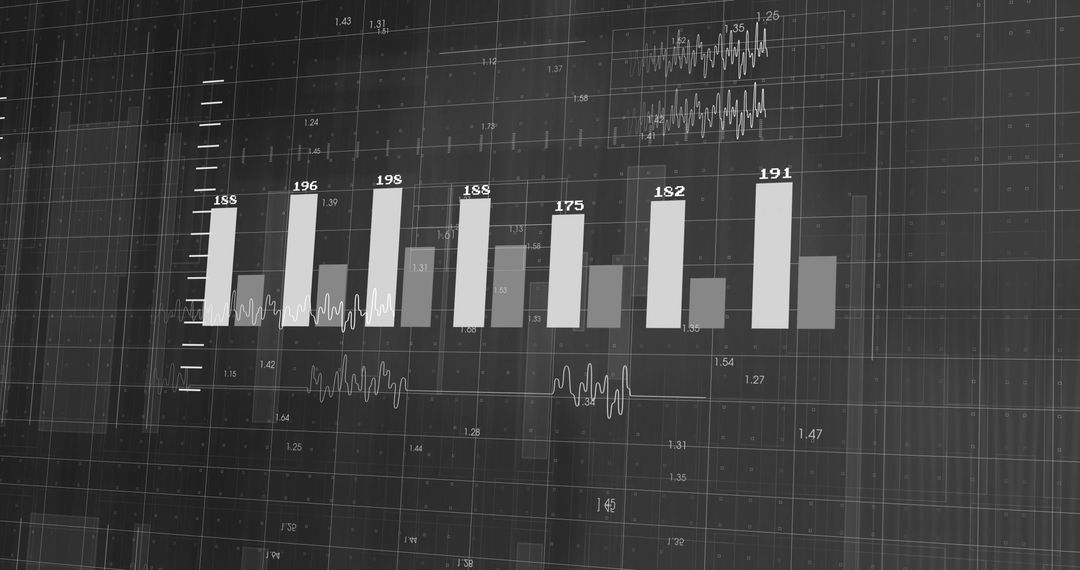
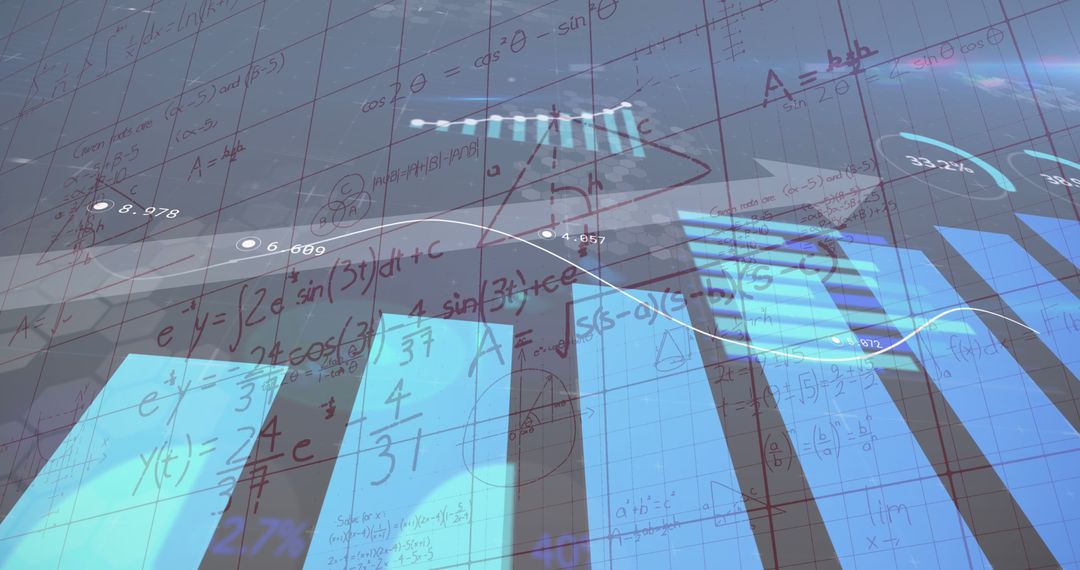
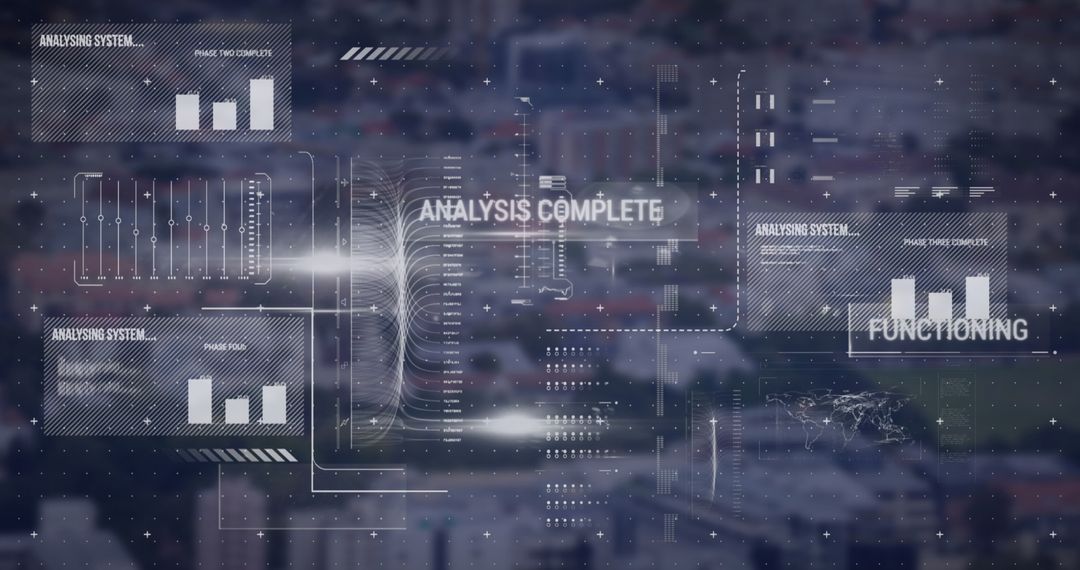
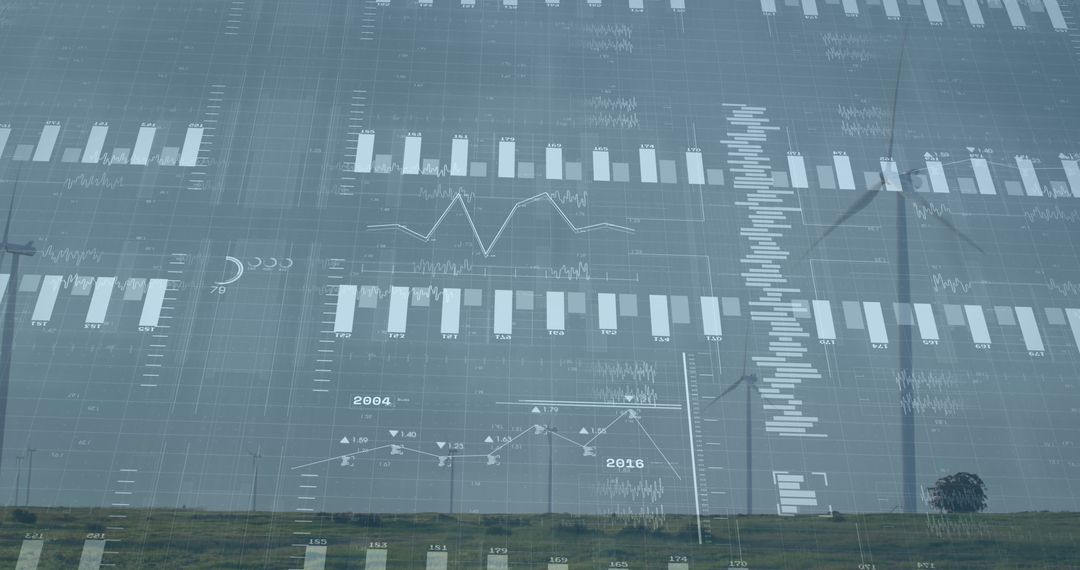
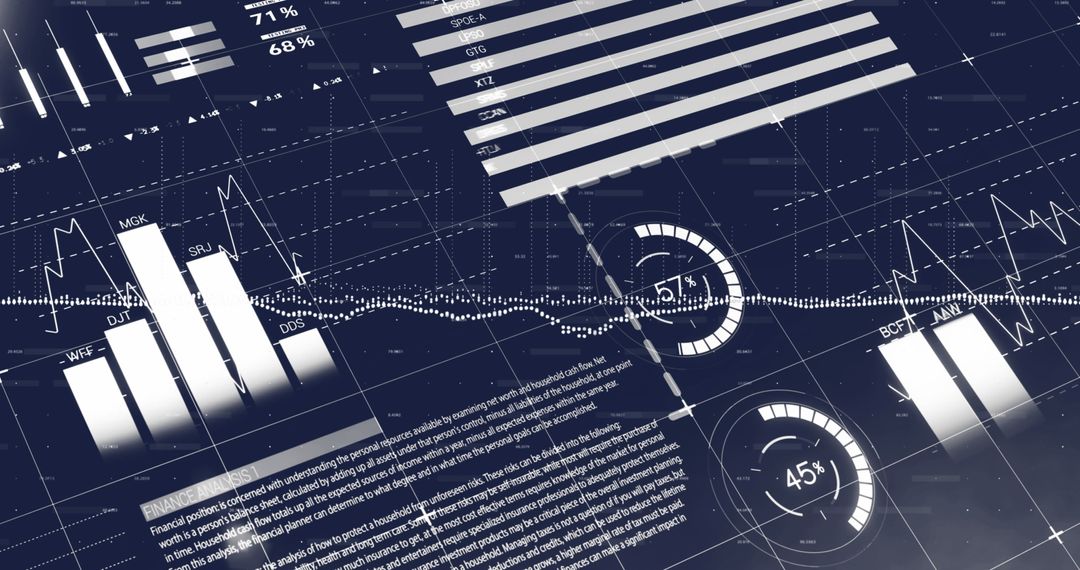
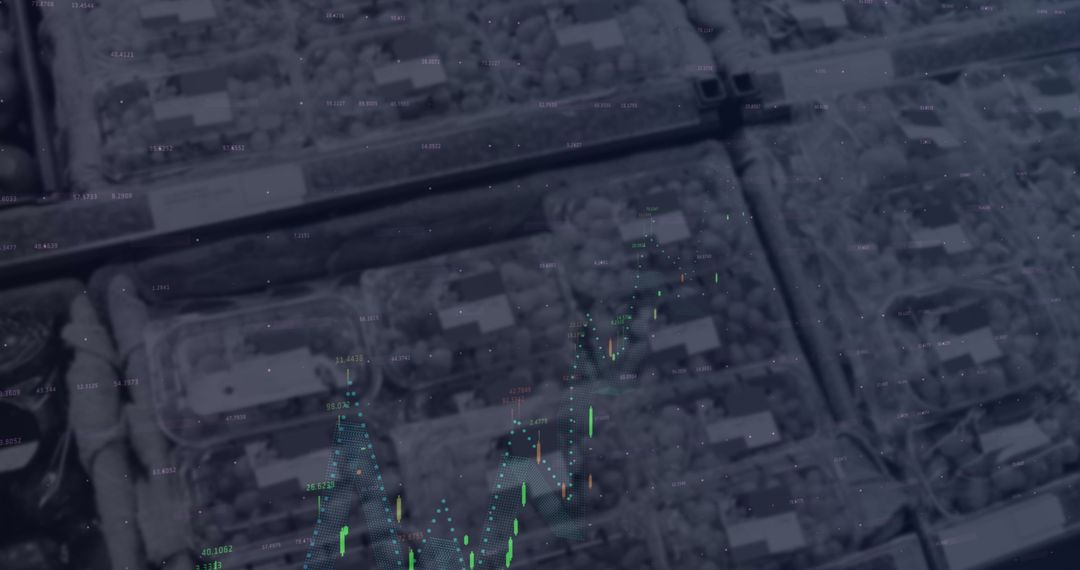
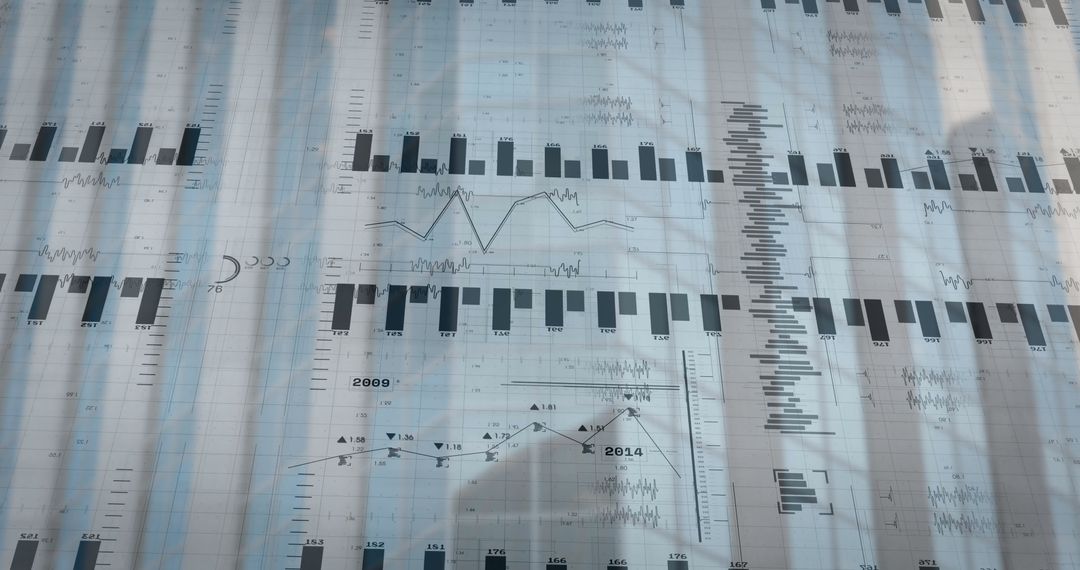
- Futuristic Digital Interface with Bar Charts and Line Graphs
Futuristic Digital Interface with Bar Charts and Line Graphs Image
A digital interface features semi-transparent bar charts, line graphs, and sparklines layered over an abstract blurred backdrop. This visual is ideal for use in presentations or articles focused on technology, data analysis, and futuristic innovations, emphasizing data-driven themes. Suitable for representing complex information systems and set in modern design contexts about analytics and tech innovations.
Powered by  - Get 15% off with code: PIKWIZARD15


0
downloads
downloads
Tags:
More
Credit Photo
If you would like to credit the Photo, here are some ways you can do so
Text Link
photo Link
<span class="text-link">
<span>
<a target="_blank" href=https://pikwizard.com/photo/futuristic-digital-interface-with-bar-charts-and-line-graphs/a172fa50b6c8ffdf70aa8e0009416451/>PikWizard</a>
</span>
</span>
<span class="image-link">
<span
style="margin: 0 0 20px 0; display: inline-block; vertical-align: middle; width: 100%;"
>
<a
target="_blank"
href="https://pikwizard.com/photo/futuristic-digital-interface-with-bar-charts-and-line-graphs/a172fa50b6c8ffdf70aa8e0009416451/"
style="text-decoration: none; font-size: 10px; margin: 0;"
>
<img src="https://pikwizard.com/pw/medium/a172fa50b6c8ffdf70aa8e0009416451.jpg" style="margin: 0; width: 100%;" alt="" />
<p style="font-size: 12px; margin: 0;">PikWizard</p>
</a>
</span>
</span>
Free (free of charge)
Free for personal and commercial use.
Author: Creative Art
Similar Free Stock Images
Premium


Premium


Premium


Premium


Premium


Premium


Premium


Premium


Premium


Premium


Premium


Premium


Premium


Premium


Premium


Premium


Premium


Premium


Premium


Premium


Premium

Premium


Premium


Premium