- Home >
- Stock Photos >
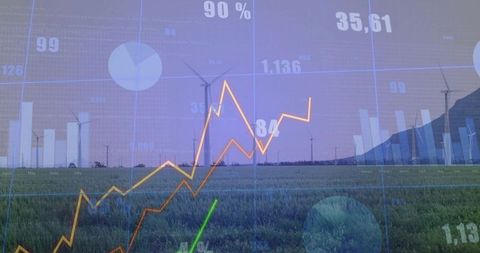
- Futuristic Digital Interface with Data Visualization and Graphics
Futuristic Digital Interface with Data Visualization and Graphics Image

Depicting an array of digital graphics and charts, showcasing modern data visualization intertwined with a green 3D element. Layers of futuristic design emphasize comprehensive data analysis, relevant for technology reviews, business solutions, webinars on innovation, or digital learning platforms focused on emerging technologies. Ideal for representing digital transformation, tech trends, and immersive data sciences literature.

downloads
Tags:
More
Credit Photo
If you would like to credit the Photo, here are some ways you can do so
Text Link
photo Link
<span class="text-link">
<span>
<a target="_blank" href=https://pikwizard.com/photo/futuristic-digital-interface-with-data-visualization-and-graphics/c6d89b959ba2fa761595159922aed9d3/>PikWizard</a>
</span>
</span>
<span class="image-link">
<span
style="margin: 0 0 20px 0; display: inline-block; vertical-align: middle; width: 100%;"
>
<a
target="_blank"
href="https://pikwizard.com/photo/futuristic-digital-interface-with-data-visualization-and-graphics/c6d89b959ba2fa761595159922aed9d3/"
style="text-decoration: none; font-size: 10px; margin: 0;"
>
<img src="https://pikwizard.com/pw/medium/c6d89b959ba2fa761595159922aed9d3.jpg" style="margin: 0; width: 100%;" alt="" />
<p style="font-size: 12px; margin: 0;">PikWizard</p>
</a>
</span>
</span>
Free (free of charge)
Free for personal and commercial use.
Author: Authentic Images