
- Home >
- Stock Photos >
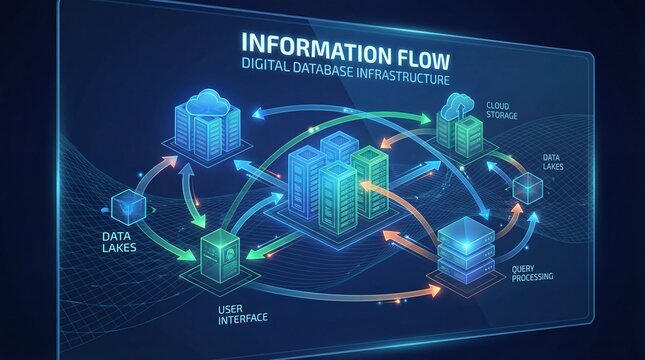
- Futuristic Digital Interface with Data Visualizations on Black
Futuristic Digital Interface with Data Visualizations on Black Image

Viewed as futuristic and advanced, perfect for global business contexts. Integrate into presentations, reports, or articles emphasizing data analysis and technological innovation. Ideal for illustrating technological solutions in articles.
Powered by 


downloads
Tags:
More
Credit Photo
If you would like to credit the Photo, here are some ways you can do so
Text Link
photo Link
<span class="text-link">
<span>
<a target="_blank" href=https://pikwizard.com/photo/futuristic-digital-interface-with-data-visualizations-on-black/d7158a838b7f3deb537ba1eadd743f44/>PikWizard</a>
</span>
</span>
<span class="image-link">
<span
style="margin: 0 0 20px 0; display: inline-block; vertical-align: middle; width: 100%;"
>
<a
target="_blank"
href="https://pikwizard.com/photo/futuristic-digital-interface-with-data-visualizations-on-black/d7158a838b7f3deb537ba1eadd743f44/"
style="text-decoration: none; font-size: 10px; margin: 0;"
>
<img src="https://pikwizard.com/pw/medium/d7158a838b7f3deb537ba1eadd743f44.jpg" style="margin: 0; width: 100%;" alt="" />
<p style="font-size: 12px; margin: 0;">PikWizard</p>
</a>
</span>
</span>
Free (free of charge)
Free for personal and commercial use.
Author: Creative Art
Similar Free Stock Images

Premium


Premium

Premium


Premium


Premium


Premium


Premium


Premium


Premium

Premium

Premium


Premium


Premium


Premium


Premium


Premium


Premium


Premium


Premium

Premium


Premium


Premium


Premium


Premium


Premium

Explore More Free Stock Images