
- Home >
- Stock Photos >
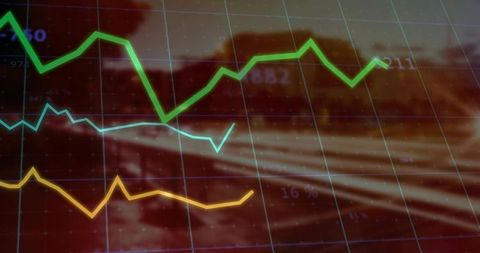
- Futuristic Digital Interface with Dynamic Financial Graph
Futuristic Digital Interface with Dynamic Financial Graph Image

This striking illustration of a digital interface features a dynamic green financial graph prominently displayed against a background of various digital readouts and data charts. Suitable for conveying themes of finance, stock market activities, technology, and data processing. Perfect for content related to financial analysis, modern technology-driven market studies, or visualizations in business presentations and reports.
Powered by 


downloads
Tags:
More
Credit Photo
If you would like to credit the Photo, here are some ways you can do so
Text Link
photo Link
<span class="text-link">
<span>
<a target="_blank" href=https://pikwizard.com/photo/futuristic-digital-interface-with-dynamic-financial-graph/1e4c4b74ee75ef658ffef3d4162c1550/>PikWizard</a>
</span>
</span>
<span class="image-link">
<span
style="margin: 0 0 20px 0; display: inline-block; vertical-align: middle; width: 100%;"
>
<a
target="_blank"
href="https://pikwizard.com/photo/futuristic-digital-interface-with-dynamic-financial-graph/1e4c4b74ee75ef658ffef3d4162c1550/"
style="text-decoration: none; font-size: 10px; margin: 0;"
>
<img src="https://pikwizard.com/pw/medium/1e4c4b74ee75ef658ffef3d4162c1550.jpg" style="margin: 0; width: 100%;" alt="" />
<p style="font-size: 12px; margin: 0;">PikWizard</p>
</a>
</span>
</span>
Free (free of charge)
Free for personal and commercial use.
Author: Authentic Images
Similar Free Stock Images

Premium


Premium


Premium

Premium


Premium


Premium


Premium


Premium

Premium


Premium


Premium


Premium


Premium


Premium

Premium

Premium


Premium


Premium


Premium


Premium


Premium


Premium


Premium


Premium

Premium


Explore More Free Stock Images