
- Home >
- Stock Photos >
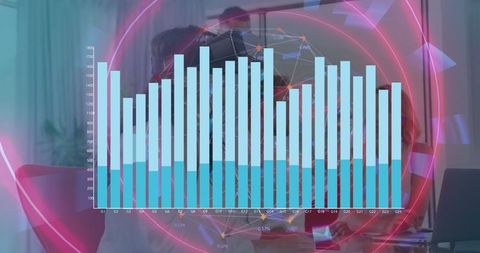
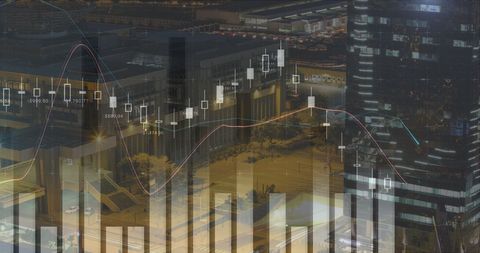
- Futuristic Digital Interface with Dynamic Graphs and Data
Futuristic Digital Interface with Dynamic Graphs and Data Image

This captivating illustration showcases a futuristic digital interface featuring dynamic white bar charts accompanied by a glowing line graph, interwoven with intricate green coding patterns. The image embodies innovation and cutting-edge technology, making it ideal for presentations, articles or promotional materials focused on data analytics, futuristic business solutions or digital trends. Its high-tech feel can accentuate topics related to financial analysis tools, tech innovation, or big data industries.
Powered by 


downloads
Tags:
More
Credit Photo
If you would like to credit the Photo, here are some ways you can do so
Text Link
photo Link
<span class="text-link">
<span>
<a target="_blank" href=https://pikwizard.com/photo/futuristic-digital-interface-with-dynamic-graphs-and-data/1a625e5f0c165989dfa8402f70a360f9/>PikWizard</a>
</span>
</span>
<span class="image-link">
<span
style="margin: 0 0 20px 0; display: inline-block; vertical-align: middle; width: 100%;"
>
<a
target="_blank"
href="https://pikwizard.com/photo/futuristic-digital-interface-with-dynamic-graphs-and-data/1a625e5f0c165989dfa8402f70a360f9/"
style="text-decoration: none; font-size: 10px; margin: 0;"
>
<img src="https://pikwizard.com/pw/medium/1a625e5f0c165989dfa8402f70a360f9.jpg" style="margin: 0; width: 100%;" alt="" />
<p style="font-size: 12px; margin: 0;">PikWizard</p>
</a>
</span>
</span>
Free (free of charge)
Free for personal and commercial use.
Author: People Creations
Similar Free Stock Images

Premium


Premium

Premium


Premium


Premium


Premium


Premium


Premium

Premium

Premium


Premium

Premium


Premium


Premium


Premium


Premium


Premium


Premium


Premium


Premium

Premium


Premium


Premium


Premium


Premium


Explore More Free Stock Images