- Home >
- Stock Photos >
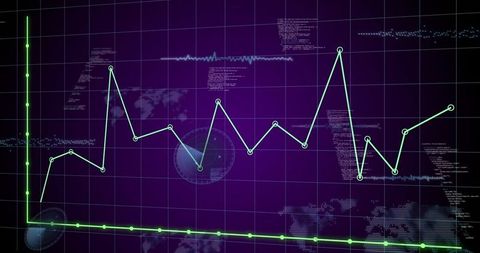
- Futuristic Digital Interface with Upward Trend Graph and C++ Code
Futuristic Digital Interface with Upward Trend Graph and C++ Code Image

This scene captures a neon green line graph trending upward against a grayscale grid display, integrated with C++ code overlay, marker lines, and circular highlights. It represents a synthesis of data analytics, programming, and digital technology advancements. Suitable for illustrating concepts in financial growth analysis, software development advertising, and technology innovation publications.

downloads
Tags:
More
Credit Photo
If you would like to credit the Photo, here are some ways you can do so
Text Link
photo Link
<span class="text-link">
<span>
<a target="_blank" href=https://pikwizard.com/photo/futuristic-digital-interface-with-upward-trend-graph-and-c-code/f554b6df1a63b48dafc9d5d0cbceee45/>PikWizard</a>
</span>
</span>
<span class="image-link">
<span
style="margin: 0 0 20px 0; display: inline-block; vertical-align: middle; width: 100%;"
>
<a
target="_blank"
href="https://pikwizard.com/photo/futuristic-digital-interface-with-upward-trend-graph-and-c-code/f554b6df1a63b48dafc9d5d0cbceee45/"
style="text-decoration: none; font-size: 10px; margin: 0;"
>
<img src="https://pikwizard.com/pw/medium/f554b6df1a63b48dafc9d5d0cbceee45.jpg" style="margin: 0; width: 100%;" alt="" />
<p style="font-size: 12px; margin: 0;">PikWizard</p>
</a>
</span>
</span>
Free (free of charge)
Free for personal and commercial use.
Author: Creative Art