
- Home >
- Stock Photos >
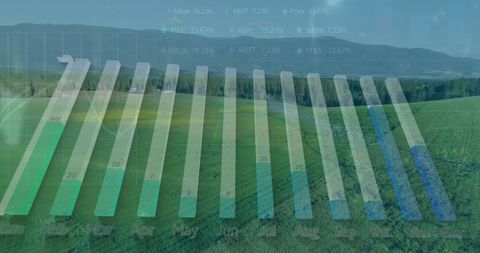
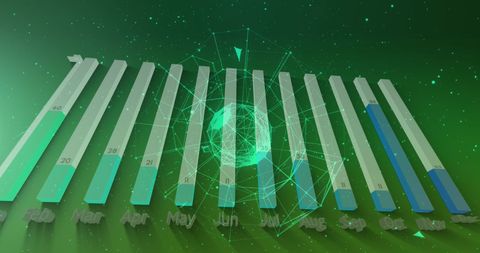
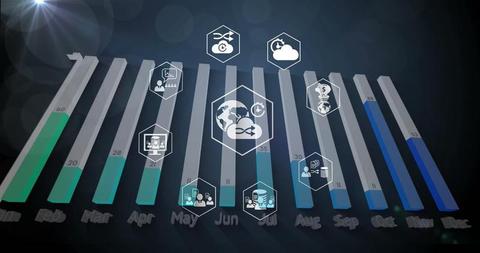
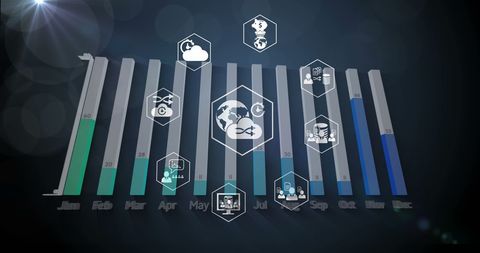
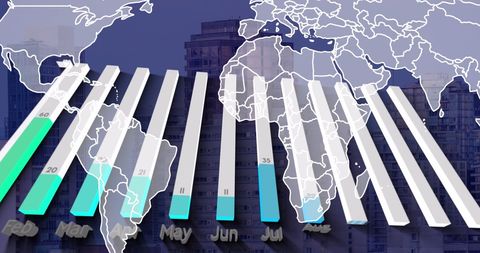
- Futuristic Digital Monthly Bar Graph with Green Background and Glowing Globe
Futuristic Digital Monthly Bar Graph with Green Background and Glowing Globe Image
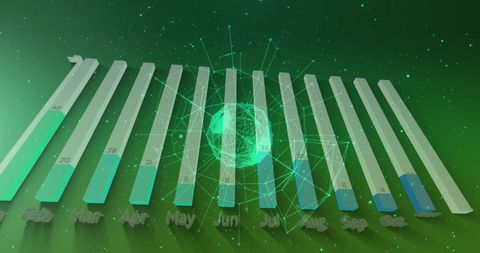
Futuristic digital bar graph displays monthly data from February to October. Green background and glowing globe add modern, tech-savvy appeal, making it ideal for technology or business presentations, data analysis reports, and financial reviews. Excellent for illustrating growth trends or performance metrics in innovative design contexts.
Powered by 


downloads
Tags:
More
Credit Photo
If you would like to credit the Photo, here are some ways you can do so
Text Link
photo Link
<span class="text-link">
<span>
<a target="_blank" href=https://pikwizard.com/photo/futuristic-digital-monthly-bar-graph-with-green-background-and-glowing-globe/96750293a2b4a9109932ab953c5c3e88/>PikWizard</a>
</span>
</span>
<span class="image-link">
<span
style="margin: 0 0 20px 0; display: inline-block; vertical-align: middle; width: 100%;"
>
<a
target="_blank"
href="https://pikwizard.com/photo/futuristic-digital-monthly-bar-graph-with-green-background-and-glowing-globe/96750293a2b4a9109932ab953c5c3e88/"
style="text-decoration: none; font-size: 10px; margin: 0;"
>
<img src="https://pikwizard.com/pw/medium/96750293a2b4a9109932ab953c5c3e88.jpg" style="margin: 0; width: 100%;" alt="" />
<p style="font-size: 12px; margin: 0;">PikWizard</p>
</a>
</span>
</span>
Free (free of charge)
Free for personal and commercial use.
Author: Authentic Images
Similar Free Stock Images

Premium


Premium


Premium


Premium


Premium
Premium


Premium


Premium


Premium


Premium


Premium


Premium


Premium

Premium


Premium

Premium


Premium


Premium

Premium


Premium


Premium


Premium

Premium


Premium


Premium


Explore More Free Stock Images