
- Home >
- Stock Photos >
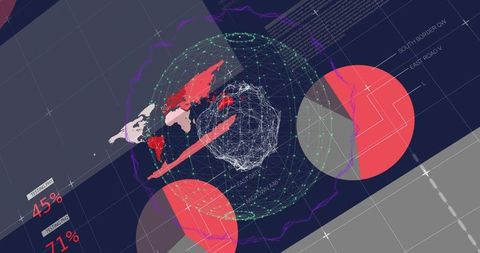
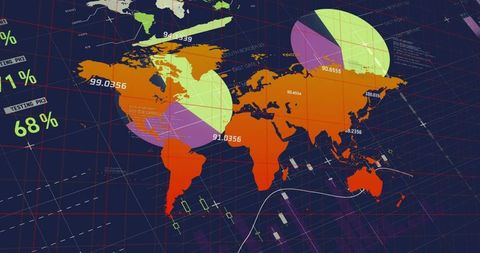
- Futuristic Digital Visualization with Neon Wireframe Globe and Analytics
Futuristic Digital Visualization with Neon Wireframe Globe and Analytics Image

This visually striking digital illustration features a neon aqua wireframe globe surrounded by pie charts and data visualizations within a digital dashboard layout. The combination of vibrant colors and modern design elements infuse the image with a sense of innovation and technological advancement. Perfect for use in futuristic technology presentations, data science publications, or as inspirational material about digital transformation and big data analytics.
Powered by 


downloads
Tags:
More
Credit Photo
If you would like to credit the Photo, here are some ways you can do so
Text Link
photo Link
<span class="text-link">
<span>
<a target="_blank" href=https://pikwizard.com/photo/futuristic-digital-visualization-with-neon-wireframe-globe-and-analytics/f40f5b9efaecfcc6236e550213e10c1f/>PikWizard</a>
</span>
</span>
<span class="image-link">
<span
style="margin: 0 0 20px 0; display: inline-block; vertical-align: middle; width: 100%;"
>
<a
target="_blank"
href="https://pikwizard.com/photo/futuristic-digital-visualization-with-neon-wireframe-globe-and-analytics/f40f5b9efaecfcc6236e550213e10c1f/"
style="text-decoration: none; font-size: 10px; margin: 0;"
>
<img src="https://pikwizard.com/pw/medium/f40f5b9efaecfcc6236e550213e10c1f.jpg" style="margin: 0; width: 100%;" alt="" />
<p style="font-size: 12px; margin: 0;">PikWizard</p>
</a>
</span>
</span>
Free (free of charge)
Free for personal and commercial use.
Author: Authentic Images
Similar Free Stock Images

Premium


Premium


Premium

Premium


Premium


Premium


Premium


Premium

Premium


Premium

Premium


Premium


Premium

Premium

Premium


Premium

Premium

Premium


Premium


Premium


Premium

Premium


Premium


Premium


Premium

Explore More Free Stock Images