
- Home >
- Stock Photos >
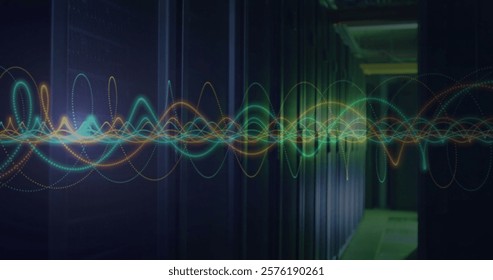
- Futuristic Digital Waveform Analytics on Neon Green Interface
Futuristic Digital Waveform Analytics on Neon Green Interface Image

Undulating multicolored waveform symbolizes dynamic data analysis on a stylish neon green grid. Complex numeric labels and hexagon forms contribute to a high-tech aesthetic. Perfect for backgrounds in tech-related presentations, websites, or ads focusing on analytics or digital data visualization.
Powered by  - Get 15% off with code: PIKWIZARD15


downloads
Tags:
More
Credit Photo
If you would like to credit the Photo, here are some ways you can do so
Text Link
photo Link
<span class="text-link">
<span>
<a target="_blank" href=https://pikwizard.com/photo/futuristic-digital-waveform-analytics-on-neon-green-interface/defa6ba83dd84050476b3d371f887f21/>PikWizard</a>
</span>
</span>
<span class="image-link">
<span
style="margin: 0 0 20px 0; display: inline-block; vertical-align: middle; width: 100%;"
>
<a
target="_blank"
href="https://pikwizard.com/photo/futuristic-digital-waveform-analytics-on-neon-green-interface/defa6ba83dd84050476b3d371f887f21/"
style="text-decoration: none; font-size: 10px; margin: 0;"
>
<img src="https://pikwizard.com/pw/medium/defa6ba83dd84050476b3d371f887f21.jpg" style="margin: 0; width: 100%;" alt="" />
<p style="font-size: 12px; margin: 0;">PikWizard</p>
</a>
</span>
</span>
Free (free of charge)
Free for personal and commercial use.
Author: Awesome Content
Similar Free Stock Images

Premium


Premium

Premium


Premium


Premium


Premium


Premium


Premium

Premium

Premium

Premium


Premium


Premium


Premium


Premium


Premium


Premium


Premium


Premium


Premium


Premium

Premium


Premium


Premium


Premium


Explore More Free Stock Images