- Home >
- Stock Photos >
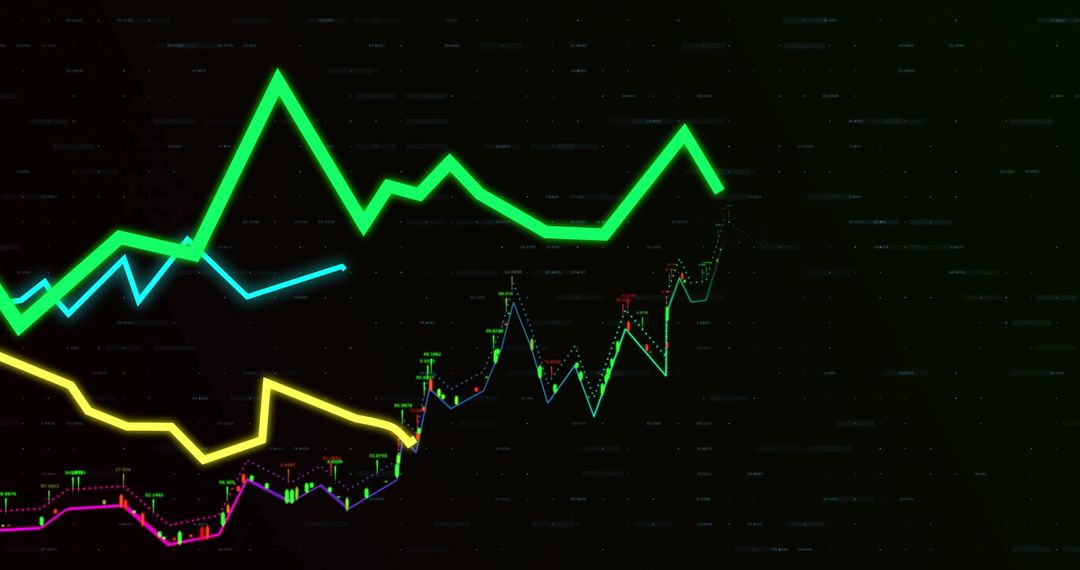
- Futuristic Digital Waves and Lines Depicting Stock Market Fluctuations
Futuristic Digital Waves and Lines Depicting Stock Market Fluctuations Image

Dynamic composition features mid-century styled glowing lines receding into distance. Implies technology, connectivity, and movement suitable for illustrating concepts such as global economy, digital communication, and data analysis, ideal for marketing purposes or backgrounds in technology-related presentations.
Powered by 


2
downloads
downloads
Tags:
More
Credit Photo
If you would like to credit the Photo, here are some ways you can do so
Text Link
photo Link
<span class="text-link">
<span>
<a target="_blank" href=https://pikwizard.com/photo/futuristic-digital-waves-and-lines-depicting-stock-market-fluctuations/d9526655a925055e1af783afbc75e6f8/>PikWizard</a>
</span>
</span>
<span class="image-link">
<span
style="margin: 0 0 20px 0; display: inline-block; vertical-align: middle; width: 100%;"
>
<a
target="_blank"
href="https://pikwizard.com/photo/futuristic-digital-waves-and-lines-depicting-stock-market-fluctuations/d9526655a925055e1af783afbc75e6f8/"
style="text-decoration: none; font-size: 10px; margin: 0;"
>
<img src="https://pikwizard.com/pw/medium/d9526655a925055e1af783afbc75e6f8.jpg" style="margin: 0; width: 100%;" alt="" />
<p style="font-size: 12px; margin: 0;">PikWizard</p>
</a>
</span>
</span>
Free (free of charge)
Free for personal and commercial use.
Author: Authentic Images
Similar Free Stock Images

Premium


Premium


Premium


Premium


Premium


Premium


Premium


Premium


Premium


Premium


Premium


Premium


Premium


Premium


Premium


Premium


Premium


Premium


Premium


Premium


Premium


Premium


Premium


Premium