- Home >
- Stock Photos >
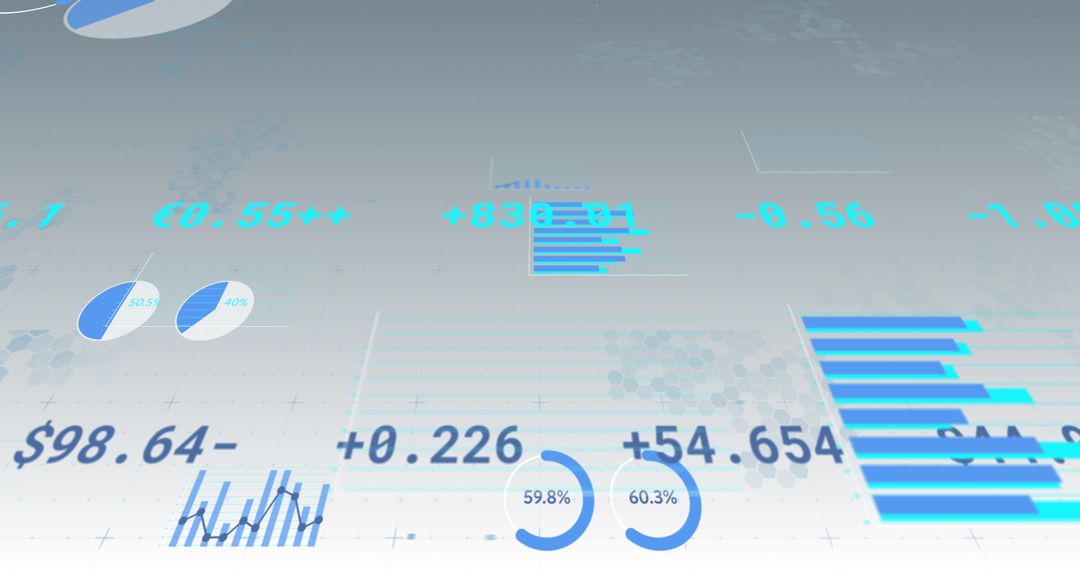
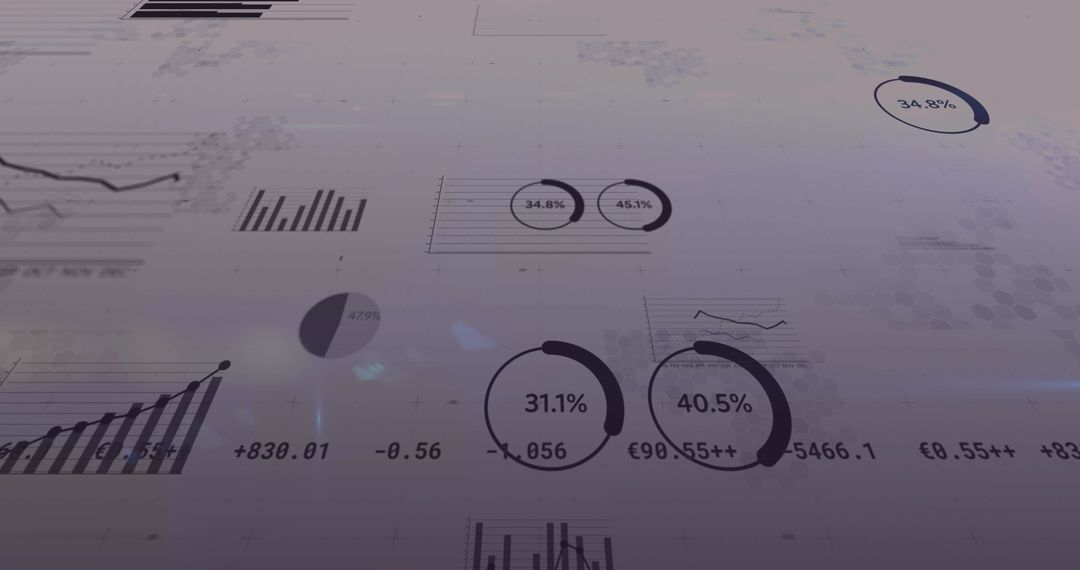
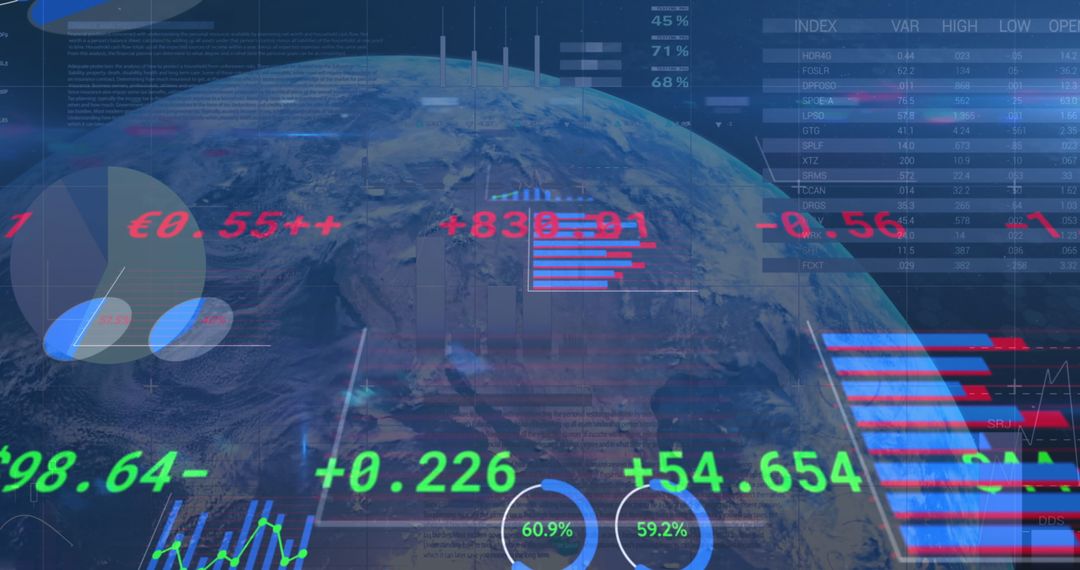
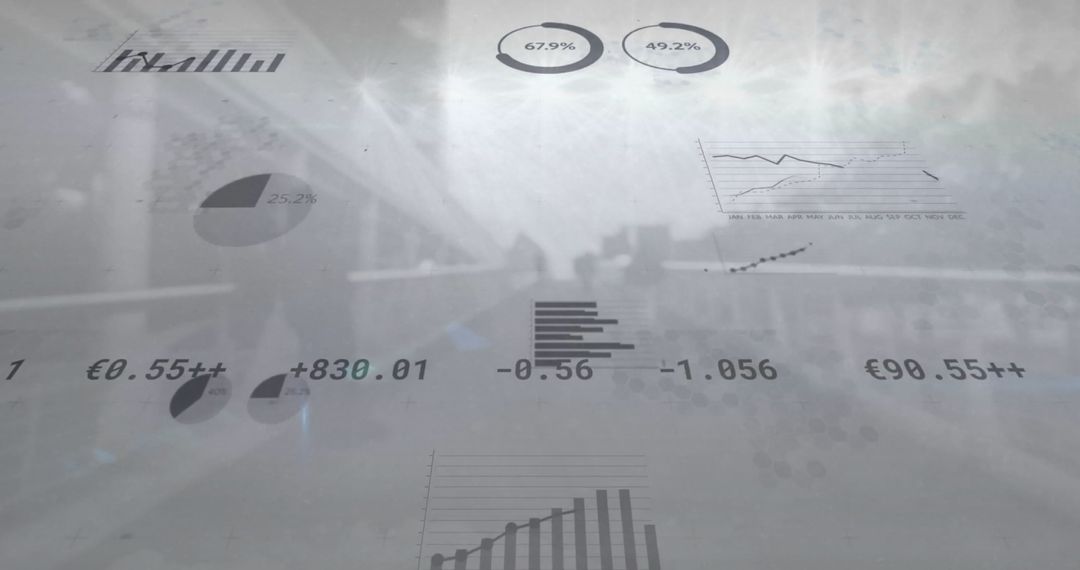
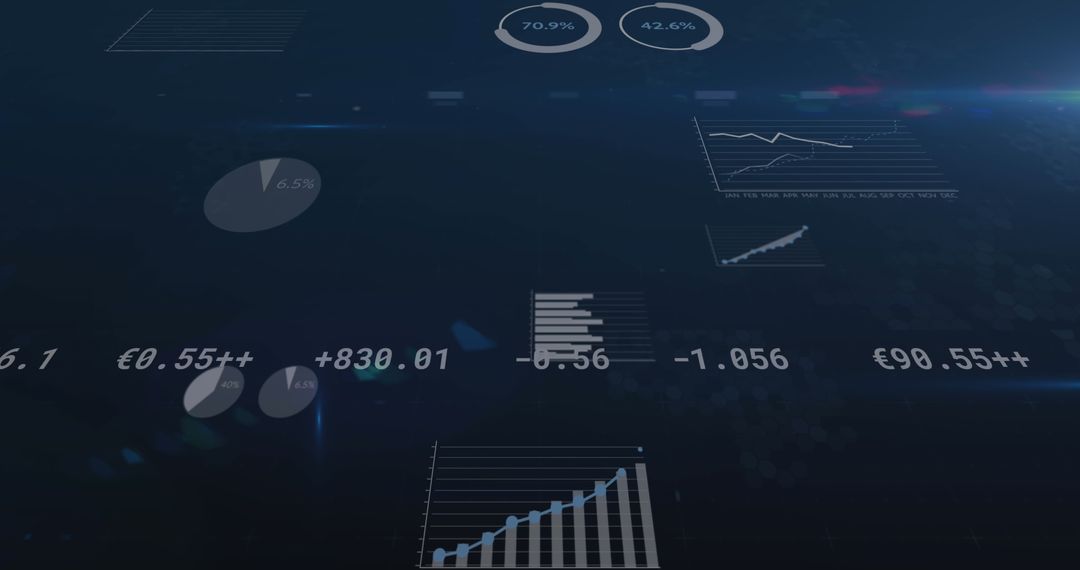
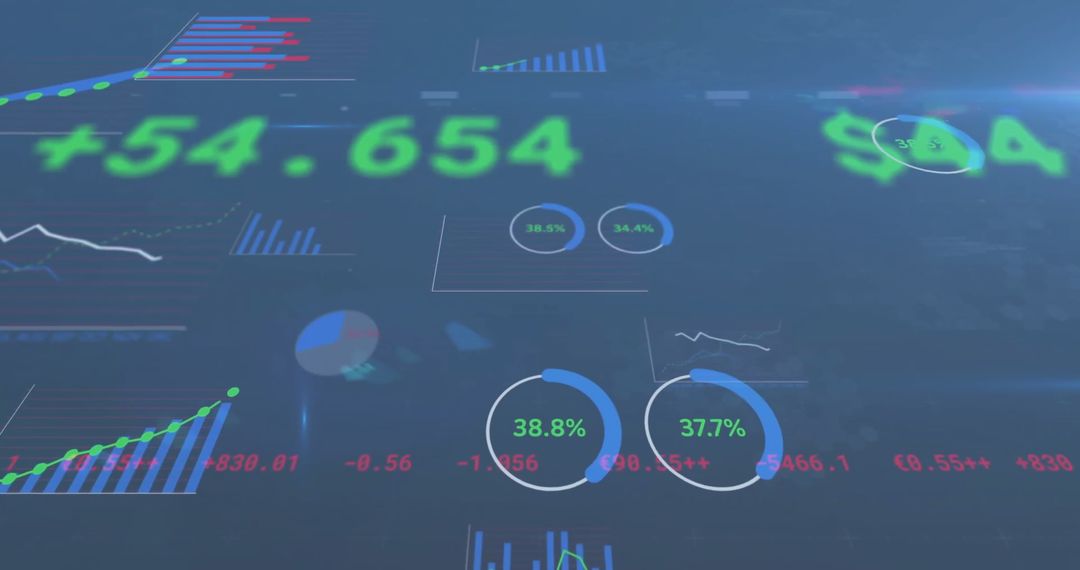
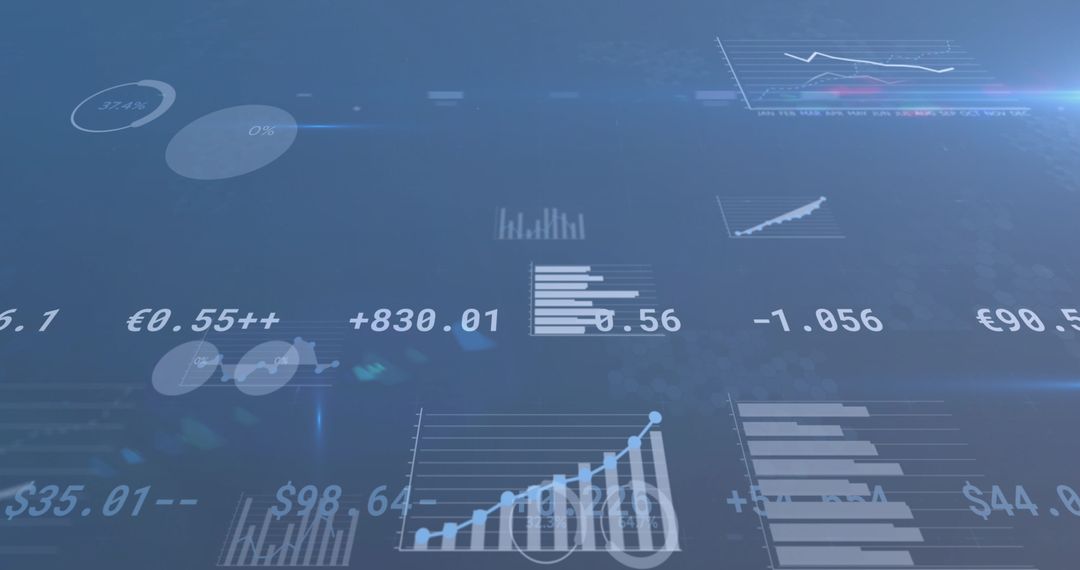
- Futuristic Display of Digital Financial Data and Charts
Futuristic Display of Digital Financial Data and Charts Image
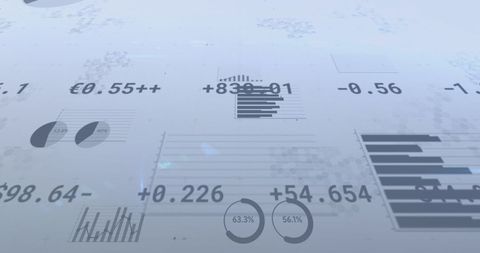
Abstract layout features financial data metrics and charts superimposed over a grey background, symbolizing business analysis and data-driven decision-making. Appropriate for articles on contemporary finance technology trends, digital banking transformations, and economic analysis tools. Ideal for use in business presentations focusing on statistics, financial growth, and technology advancements in global markets.
Powered by  - Get 15% off with code: PIKWIZARD15


0
downloads
downloads
Tags:
More
Credit Photo
If you would like to credit the Photo, here are some ways you can do so
Text Link
photo Link
<span class="text-link">
<span>
<a target="_blank" href=https://pikwizard.com/photo/futuristic-display-of-digital-financial-data-and-charts/f88f70b311bddaf45efbd3ef79271f13/>PikWizard</a>
</span>
</span>
<span class="image-link">
<span
style="margin: 0 0 20px 0; display: inline-block; vertical-align: middle; width: 100%;"
>
<a
target="_blank"
href="https://pikwizard.com/photo/futuristic-display-of-digital-financial-data-and-charts/f88f70b311bddaf45efbd3ef79271f13/"
style="text-decoration: none; font-size: 10px; margin: 0;"
>
<img src="https://pikwizard.com/pw/medium/f88f70b311bddaf45efbd3ef79271f13.jpg" style="margin: 0; width: 100%;" alt="" />
<p style="font-size: 12px; margin: 0;">PikWizard</p>
</a>
</span>
</span>
Free (free of charge)
Free for personal and commercial use.
Author: People Creations
Similar Free Stock Images
Premium

Premium


Premium

Premium


Premium


Premium


Premium

Premium


Premium


Premium


Premium


Premium


Premium
Premium

Premium


Premium

Premium


Premium


Premium


Premium

Premium


Premium

Premium


Premium