- Home >
- Stock Photos >
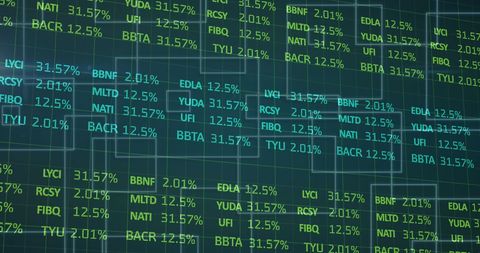
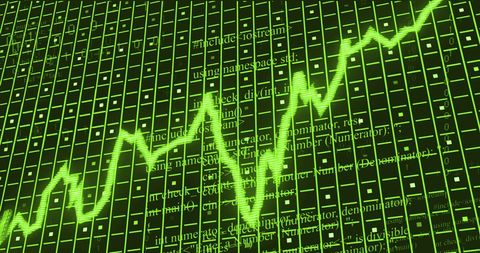
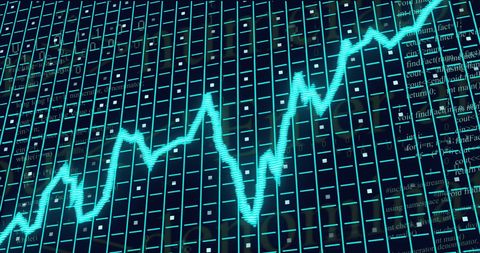
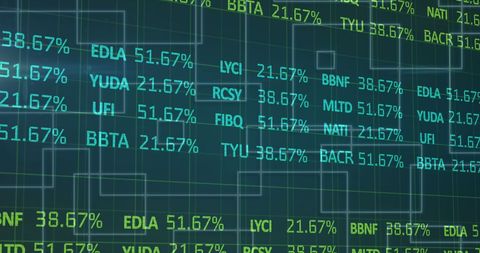
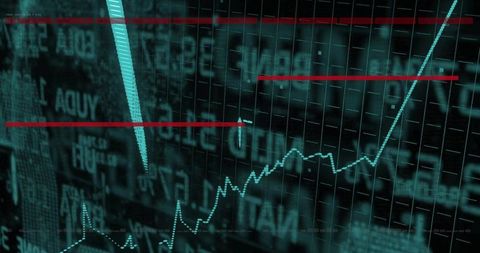
- Futuristic Double Helix and Stock Data Visualization
Futuristic Double Helix and Stock Data Visualization Image

Double helix imagery blended with stock trading elements suggests a merging of biology and financial data analysis. Featuring glitch effects, this can illustrate concepts like biotechnology investments or data analytics for finance firms. Suitable for website backgrounds, business analysis reports, or financial tech presentations.

downloads
Tags:
More
Credit Photo
If you would like to credit the Photo, here are some ways you can do so
Text Link
photo Link
<span class="text-link">
<span>
<a target="_blank" href=https://pikwizard.com/photo/futuristic-double-helix-and-stock-data-visualization/f27a4375ad48b75869cede16cc818352/>PikWizard</a>
</span>
</span>
<span class="image-link">
<span
style="margin: 0 0 20px 0; display: inline-block; vertical-align: middle; width: 100%;"
>
<a
target="_blank"
href="https://pikwizard.com/photo/futuristic-double-helix-and-stock-data-visualization/f27a4375ad48b75869cede16cc818352/"
style="text-decoration: none; font-size: 10px; margin: 0;"
>
<img src="https://pikwizard.com/pw/medium/f27a4375ad48b75869cede16cc818352.jpg" style="margin: 0; width: 100%;" alt="" />
<p style="font-size: 12px; margin: 0;">PikWizard</p>
</a>
</span>
</span>
Free (free of charge)
Free for personal and commercial use.
Author: Authentic Images