
- Home >
- Stock Photos >
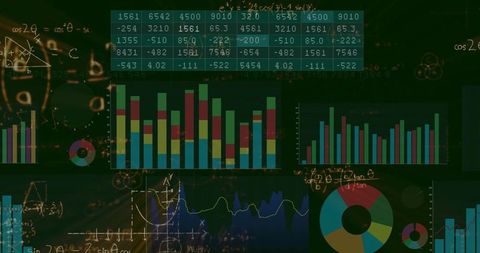
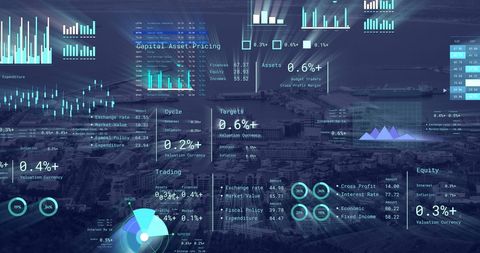
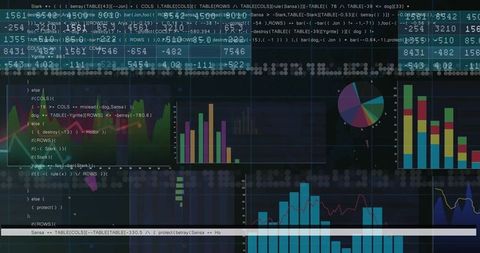
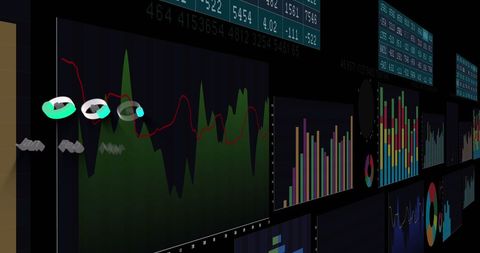
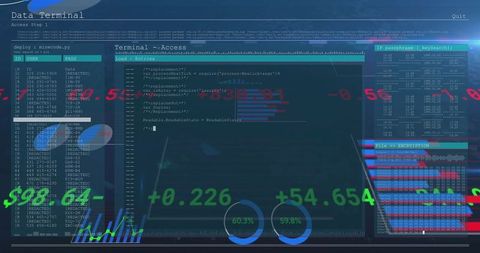
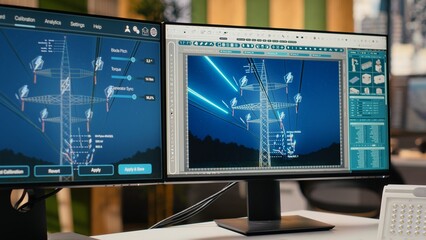
- Futuristic Energy Dashboard Interface for Data Visualization
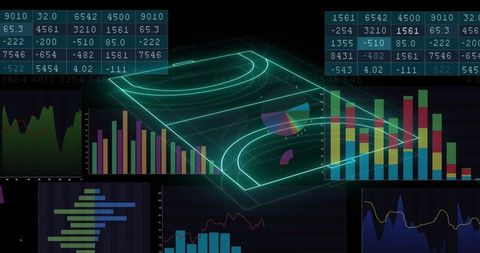
Futuristic Energy Dashboard Interface for Data Visualization Image
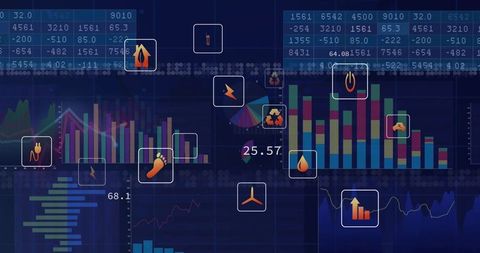
This illustration features a futuristic digital energy dashboard displayed in an advanced interface with colorful bar charts and energy icons. It highlights data visualization in the context of energy analytics, showcasing various energy sources and consumption metrics. Ideal for use in presentations related to energy management, smart technology, sustainability workflows, or renewable energy reporting. Graphic designers and science communicators can leverage this visual for engaging multimedia reports and educational platforms.
Powered by 


downloads
Tags:
More
Credit Photo
If you would like to credit the Photo, here are some ways you can do so
Text Link
photo Link
<span class="text-link">
<span>
<a target="_blank" href=https://pikwizard.com/photo/futuristic-energy-dashboard-interface-for-data-visualization/79af9794beae1646fd13c85b0d98fed5/>PikWizard</a>
</span>
</span>
<span class="image-link">
<span
style="margin: 0 0 20px 0; display: inline-block; vertical-align: middle; width: 100%;"
>
<a
target="_blank"
href="https://pikwizard.com/photo/futuristic-energy-dashboard-interface-for-data-visualization/79af9794beae1646fd13c85b0d98fed5/"
style="text-decoration: none; font-size: 10px; margin: 0;"
>
<img src="https://pikwizard.com/pw/medium/79af9794beae1646fd13c85b0d98fed5.jpg" style="margin: 0; width: 100%;" alt="" />
<p style="font-size: 12px; margin: 0;">PikWizard</p>
</a>
</span>
</span>
Free (free of charge)
Free for personal and commercial use.
Author: Creative Art
Similar Free Stock Images

Premium


Premium


Premium


Premium


Premium

Premium


Premium


Premium
Premium


Premium


Premium

Premium


Premium


Premium


Premium


Premium


Premium


Premium


Premium

Premium


Premium


Premium


Premium


Premium


Premium

Explore More Free Stock Images