- Home >
- Free Stock Photos & Images >
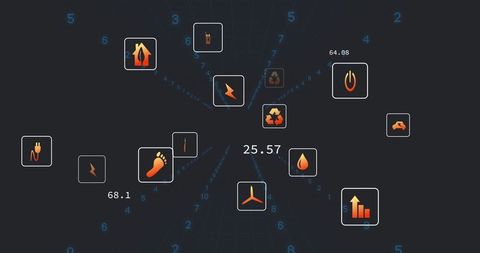
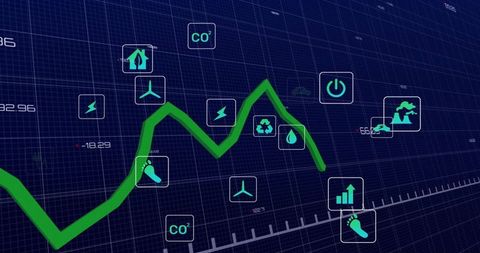
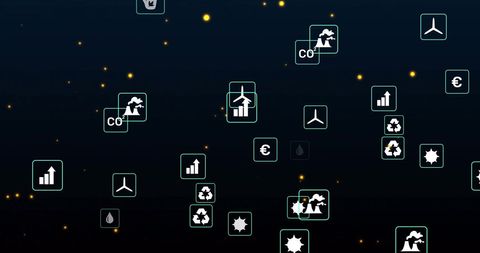
- Futuristic Energy Dashboard Visualizing CO2 Emissions, Binary Analytics and Point-Cloud Terrain
Futuristic Energy Dashboard Visualizing CO2 Emissions, Binary Analytics and Point-Cloud Terrain Free Stock Image
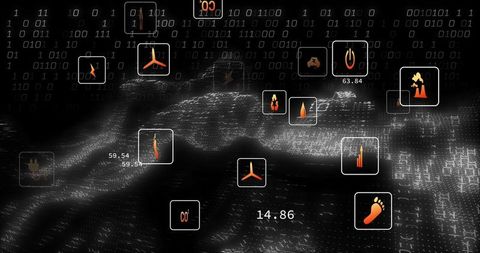
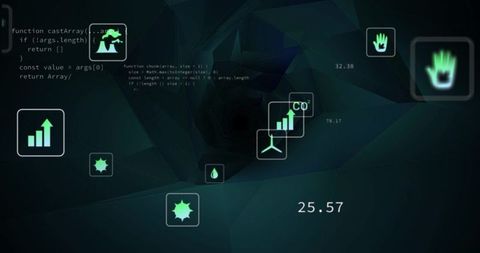
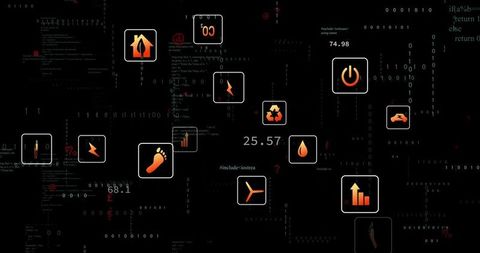
Displaying floating icons and numeric readouts over dark point-cloud terrain, featuring neon orange glyphs for CO2, power plant, wind turbine, footprint and energy bars overlaid on binary code and digital grid. Providing high-contrast, data-driven aesthetic with depth and motion created by flowing numeric terrain. Helping convey real-time monitoring, emissions analysis, sensor telemetry and predictive analytics for energy and sustainability contexts. Suited for hero banners, slide decks for sustainability reports, editorial illustrations for technology and environment articles, dashboard mockups, investor presentations and trade show graphics. Allowing easy placement of headline text or UI elements over negative space; encouraging dark theme designs with white or neon text for strong contrast. Ideal for energy companies, utilities, cleantech startups, environmental agencies and data teams wanting modern, technical visuals for reports and marketing.

downloads
Credit Photo
If you would like to credit the Photo, here are some ways you can do so
Free (free of charge)
Free for personal and commercial use.
Author: Authentic Images