- Home >
- Stock Photos >
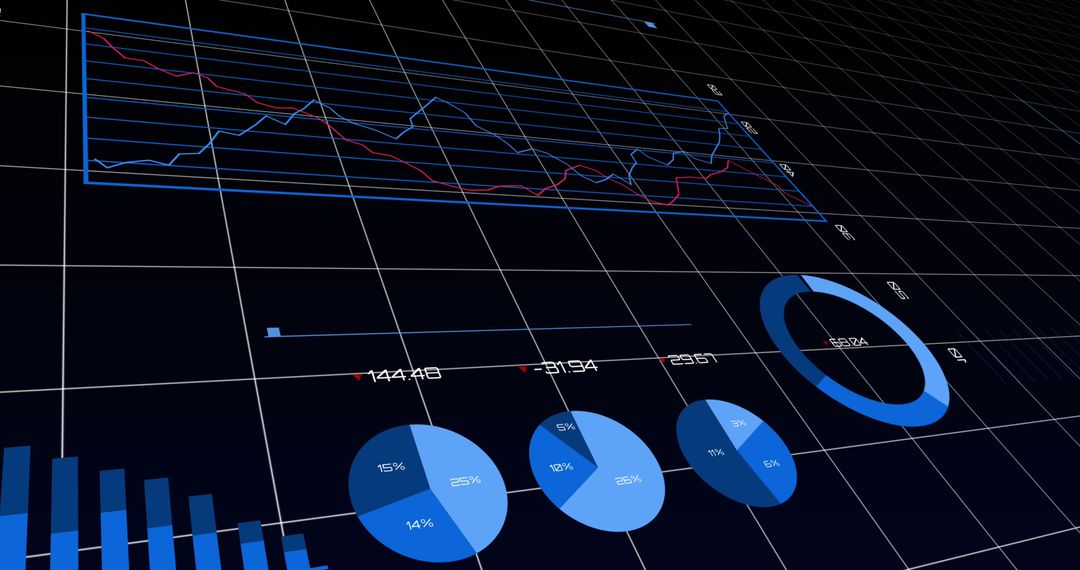
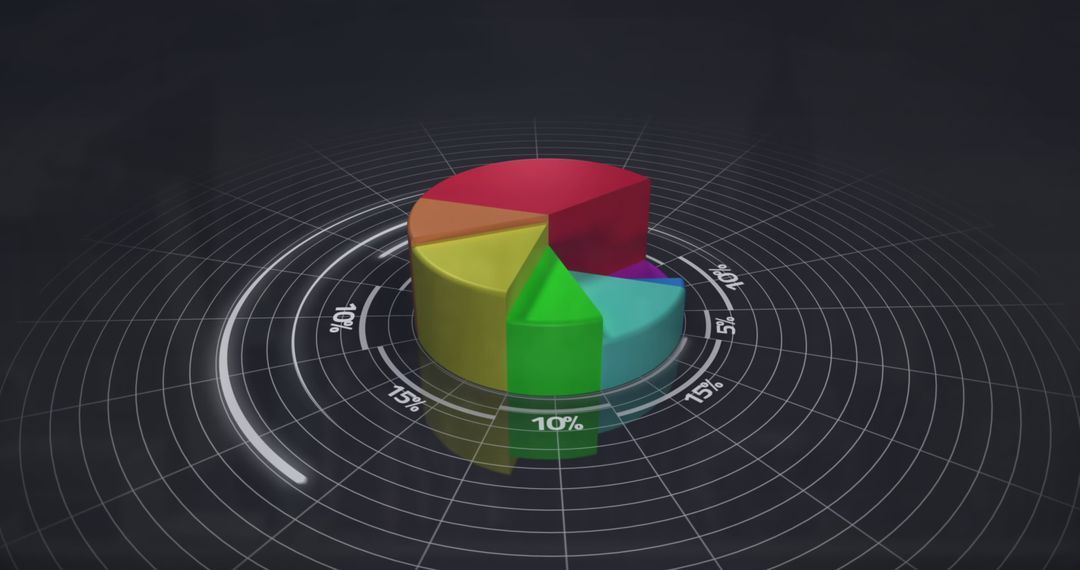
- Futuristic Finance Analysis with 3D Pie Chart and Graph
Futuristic Finance Analysis with 3D Pie Chart and Graph Image

Dynamic 3D pie chart with grid lines and data points representing financial analytics. Use in business presentations, finance-related blogs, or educational materials related to data visualization and statistics.
Powered by  - Get 15% off with code: PIKWIZARD15


0
downloads
downloads
Tags:
More
Credit Photo
If you would like to credit the Photo, here are some ways you can do so
Text Link
photo Link
<span class="text-link">
<span>
<a target="_blank" href=https://pikwizard.com/photo/futuristic-finance-analysis-with-3d-pie-chart-and-graph/f8069bd52ef829da60fc8b1ae40e4362/>PikWizard</a>
</span>
</span>
<span class="image-link">
<span
style="margin: 0 0 20px 0; display: inline-block; vertical-align: middle; width: 100%;"
>
<a
target="_blank"
href="https://pikwizard.com/photo/futuristic-finance-analysis-with-3d-pie-chart-and-graph/f8069bd52ef829da60fc8b1ae40e4362/"
style="text-decoration: none; font-size: 10px; margin: 0;"
>
<img src="https://pikwizard.com/pw/medium/f8069bd52ef829da60fc8b1ae40e4362.jpg" style="margin: 0; width: 100%;" alt="" />
<p style="font-size: 12px; margin: 0;">PikWizard</p>
</a>
</span>
</span>
Free (free of charge)
Free for personal and commercial use.
Author: Awesome Content
Similar Free Stock Images

Premium


Premium


Premium


Premium


Premium


Premium


Premium


Premium


Premium


Premium