- Home >
- Stock Photos >
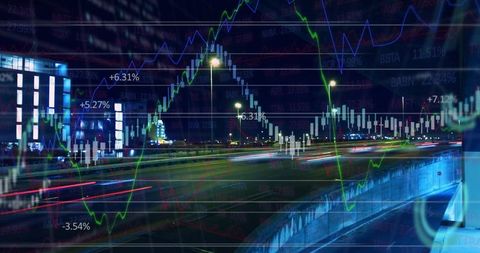
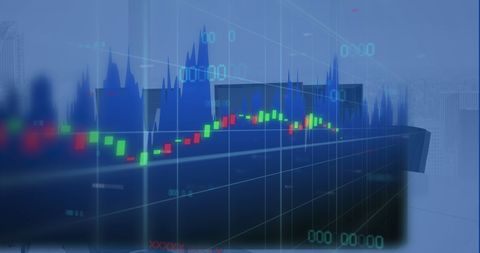
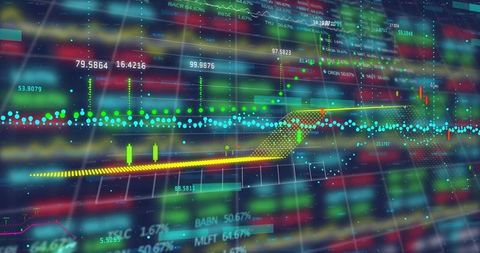
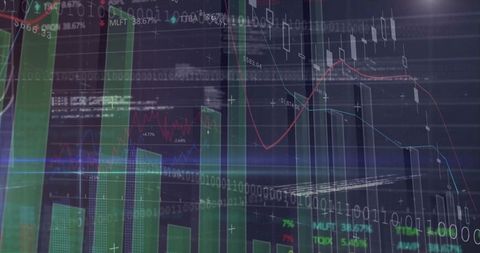
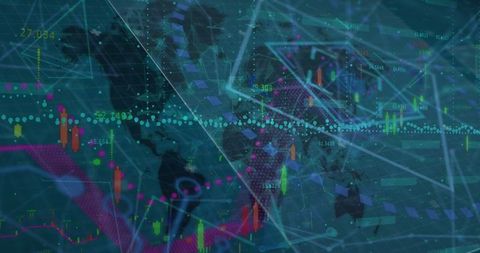
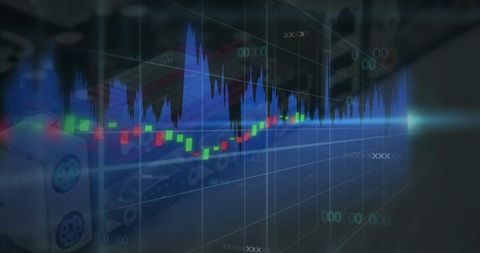
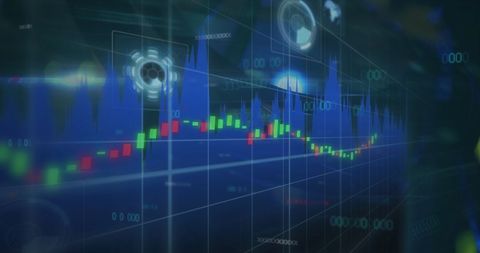
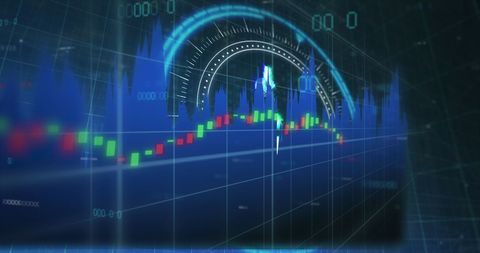
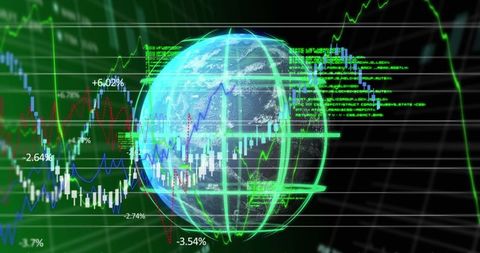
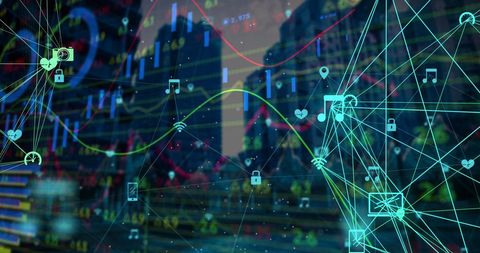
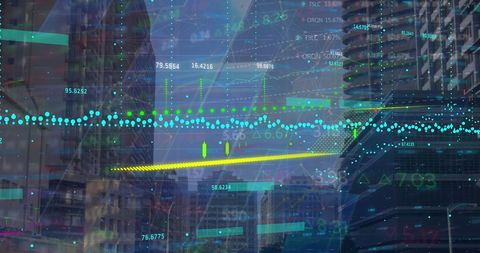
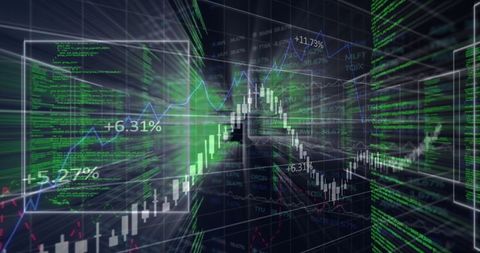
- Futuristic Finance Dashboard with Candlesticks and Data Network
Futuristic Finance Dashboard with Candlesticks and Data Network Image
Digital visualization depicting advanced financial data and network integration. Candlestick and blue graph conveying stock market movements enhanced with futuristic network overlay. Ideal for illustrating themes of investment. Suitable for technology editorials, finance blogs, data analytics displays, or presentations focused on financial markets and trading dynamics.

downloads
Tags:
More
Credit Photo
If you would like to credit the Photo, here are some ways you can do so
Text Link
photo Link
<span class="text-link">
<span>
<a target="_blank" href=https://pikwizard.com/photo/futuristic-finance-dashboard-with-candlesticks-and-data-network/b42e22367ef5d7f9082a4aa08c64f837/>PikWizard</a>
</span>
</span>
<span class="image-link">
<span
style="margin: 0 0 20px 0; display: inline-block; vertical-align: middle; width: 100%;"
>
<a
target="_blank"
href="https://pikwizard.com/photo/futuristic-finance-dashboard-with-candlesticks-and-data-network/b42e22367ef5d7f9082a4aa08c64f837/"
style="text-decoration: none; font-size: 10px; margin: 0;"
>
<img src="https://pikwizard.com/pw/medium/b42e22367ef5d7f9082a4aa08c64f837.jpg" style="margin: 0; width: 100%;" alt="" />
<p style="font-size: 12px; margin: 0;">PikWizard</p>
</a>
</span>
</span>
Free (free of charge)
Free for personal and commercial use.
Author: Creative Art