
- Home >
- Stock Photos >
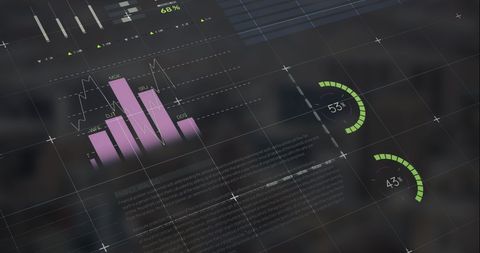
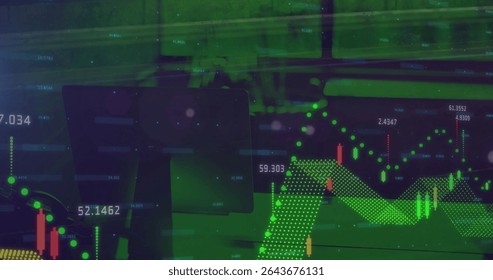
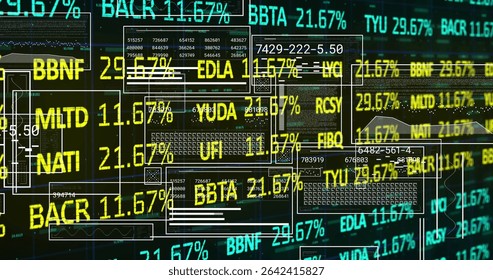
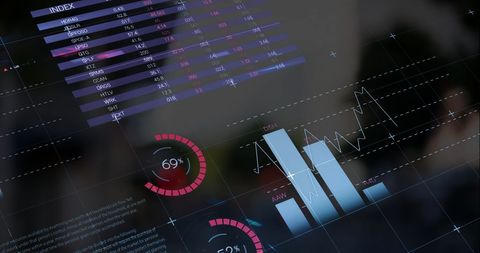
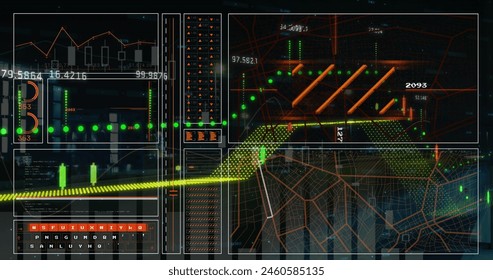
- Futuristic Finance Data Processing on Digital Display
Futuristic Finance Data Processing on Digital Display Image

Visual merges digital display elements with financial data processing examples making it ideal for concepts relating to modern finance, technology integration in business, or analytics. This is suitable for use in publications on financial forecasting, business intelligence software, and technological advancements in global business strategies.
Powered by  - Get 15% off with code: PIKWIZARD15


downloads
Tags:
More
Credit Photo
If you would like to credit the Photo, here are some ways you can do so
Text Link
photo Link
<span class="text-link">
<span>
<a target="_blank" href=https://pikwizard.com/photo/futuristic-finance-data-processing-on-digital-display/c13c2998d271f86580942a18d9f7c5e0/>PikWizard</a>
</span>
</span>
<span class="image-link">
<span
style="margin: 0 0 20px 0; display: inline-block; vertical-align: middle; width: 100%;"
>
<a
target="_blank"
href="https://pikwizard.com/photo/futuristic-finance-data-processing-on-digital-display/c13c2998d271f86580942a18d9f7c5e0/"
style="text-decoration: none; font-size: 10px; margin: 0;"
>
<img src="https://pikwizard.com/pw/medium/c13c2998d271f86580942a18d9f7c5e0.jpg" style="margin: 0; width: 100%;" alt="" />
<p style="font-size: 12px; margin: 0;">PikWizard</p>
</a>
</span>
</span>
Free (free of charge)
Free for personal and commercial use.
Author: People Creations
Similar Free Stock Images

Premium


Premium


Premium


Premium


Premium


Premium
Premium


Premium


Premium

Premium


Premium


Premium

Premium


Premium


Premium


Premium


Premium


Premium


Premium


Premium

Premium


Premium

Premium


Premium


Premium


Explore More Free Stock Images