- Home >
- Stock Photos >
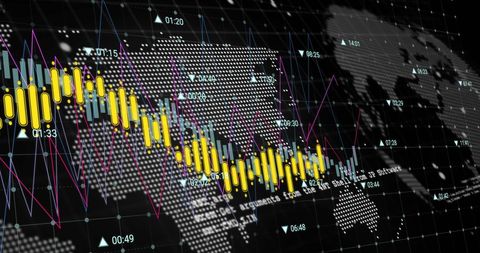
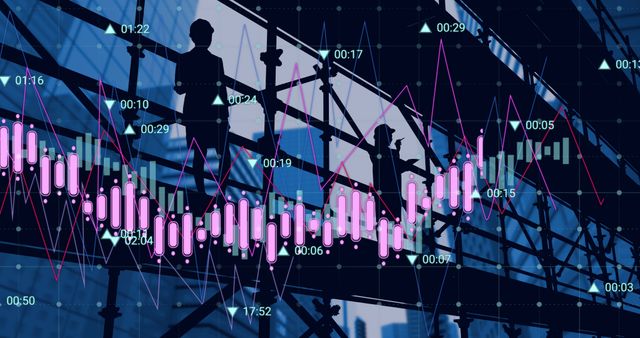
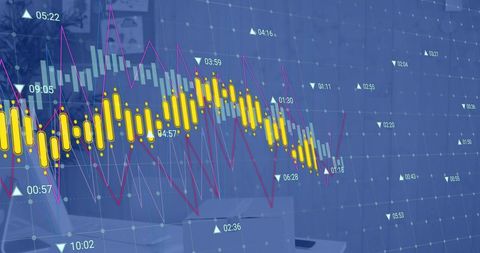
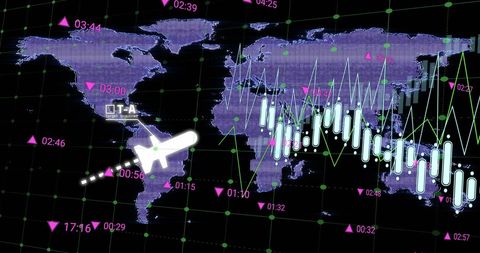
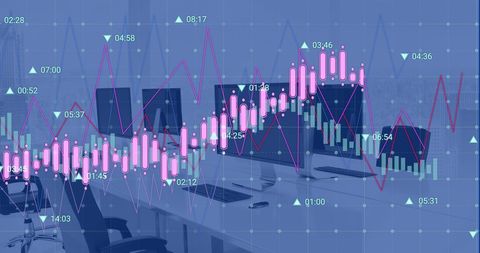
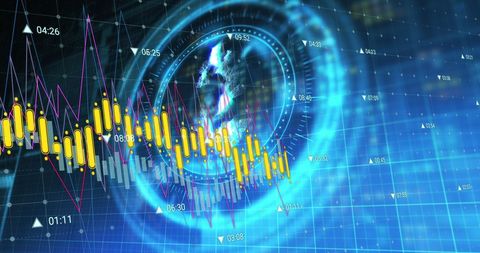
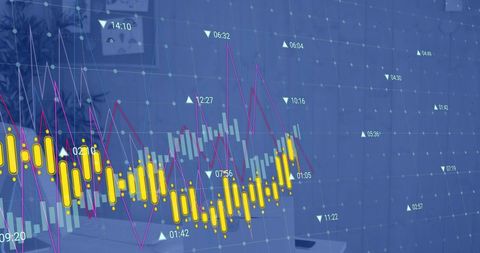
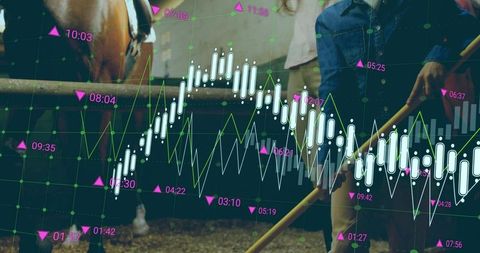
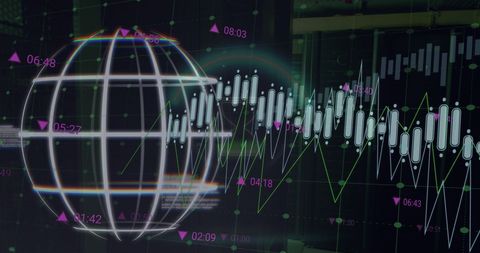
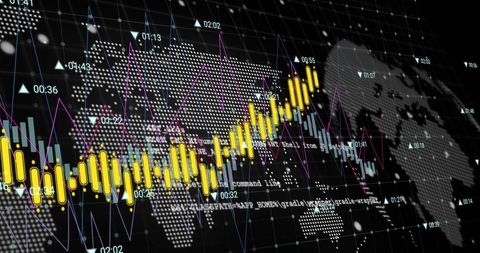
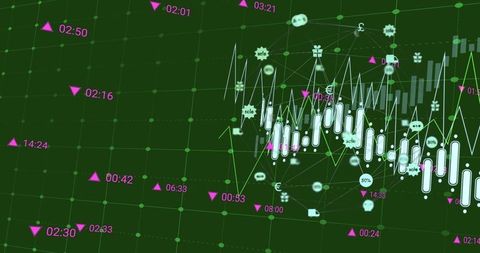
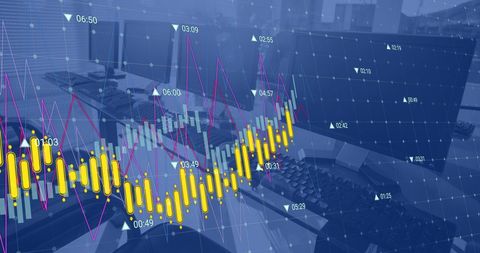
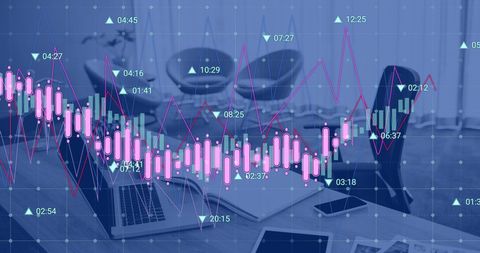
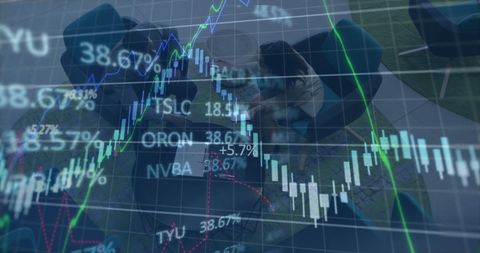
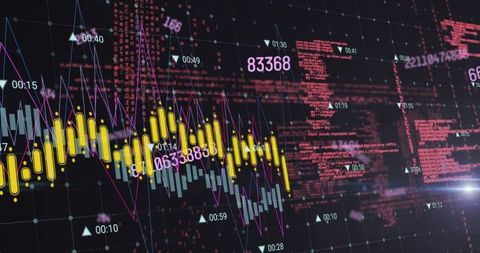
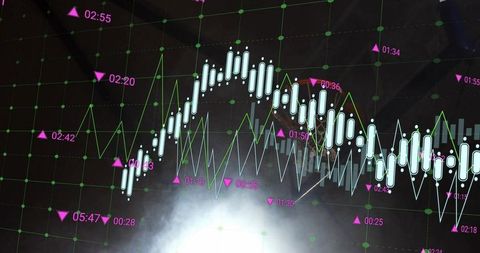
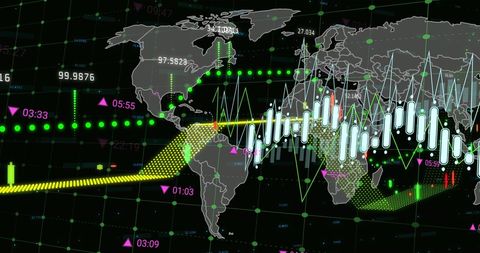
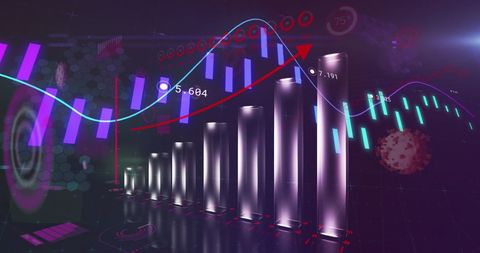
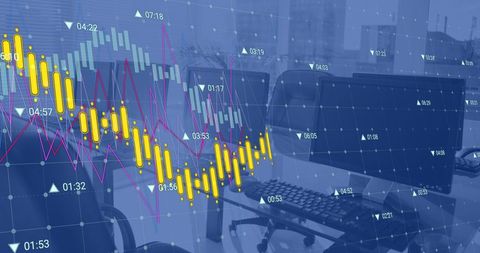
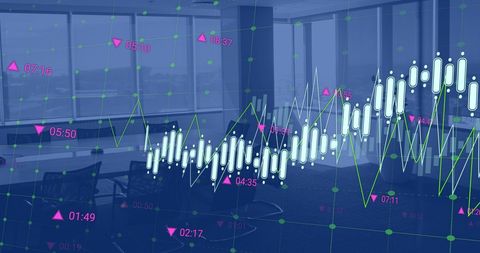
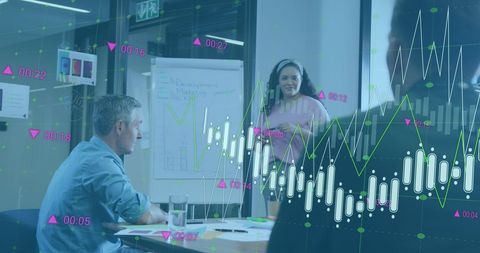
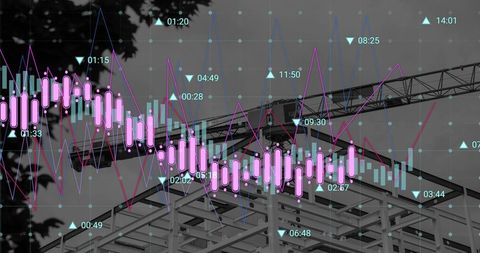
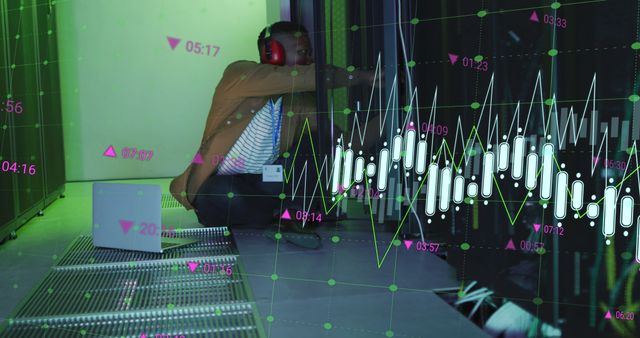
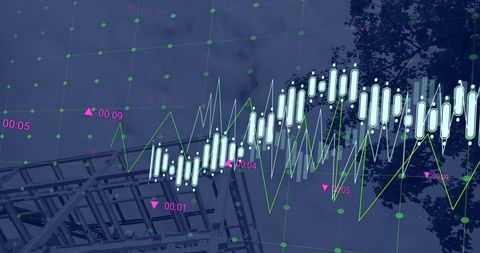
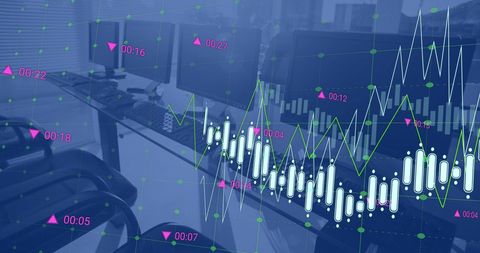
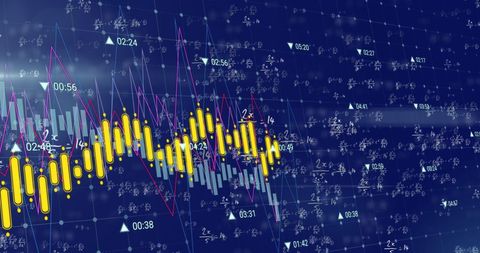
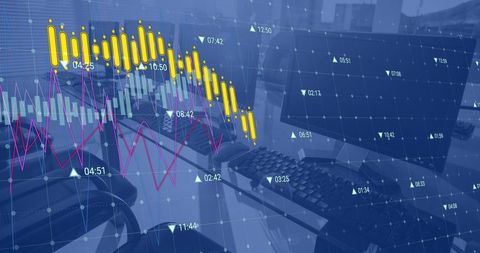
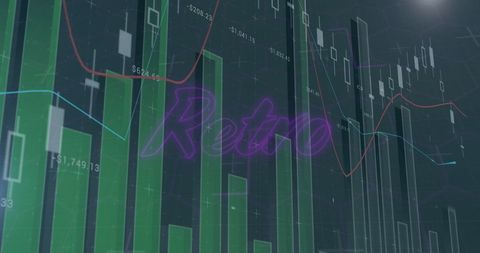
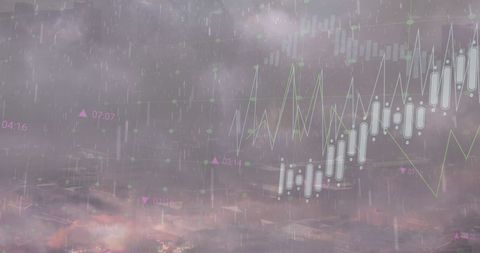
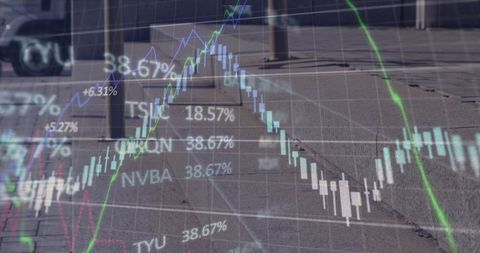
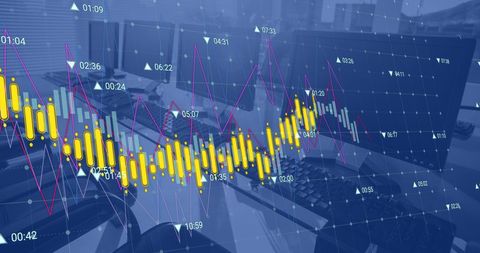
- Futuristic Finance Data Visualization with Candlestick Chart
Futuristic Finance Data Visualization with Candlestick Chart Image
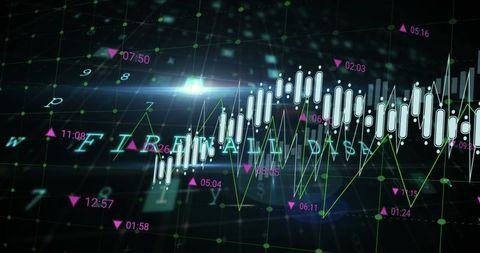
Depicting complex financial data through a mix of candlestick and line graphics, this image embodies futuristic technology and digital analytics. Predominantly on a dark virtual interface, the economic figures and varying colors of graphs symbolize online trading and advanced reporting techniques. Useful for illustrating articles about modern finance, stock market trends, technology reliance in investments, or data analysis insights.

downloads
Tags:
More
Credit Photo
If you would like to credit the Photo, here are some ways you can do so
Text Link
photo Link
<span class="text-link">
<span>
<a target="_blank" href=https://pikwizard.com/photo/futuristic-finance-data-visualization-with-candlestick-chart/13d9aea626febc41416e4d0879a56c12/>PikWizard</a>
</span>
</span>
<span class="image-link">
<span
style="margin: 0 0 20px 0; display: inline-block; vertical-align: middle; width: 100%;"
>
<a
target="_blank"
href="https://pikwizard.com/photo/futuristic-finance-data-visualization-with-candlestick-chart/13d9aea626febc41416e4d0879a56c12/"
style="text-decoration: none; font-size: 10px; margin: 0;"
>
<img src="https://pikwizard.com/pw/medium/13d9aea626febc41416e4d0879a56c12.jpg" style="margin: 0; width: 100%;" alt="" />
<p style="font-size: 12px; margin: 0;">PikWizard</p>
</a>
</span>
</span>
Free (free of charge)
Free for personal and commercial use.
Author: Authentic Images