
- Home >
- Stock Photos >
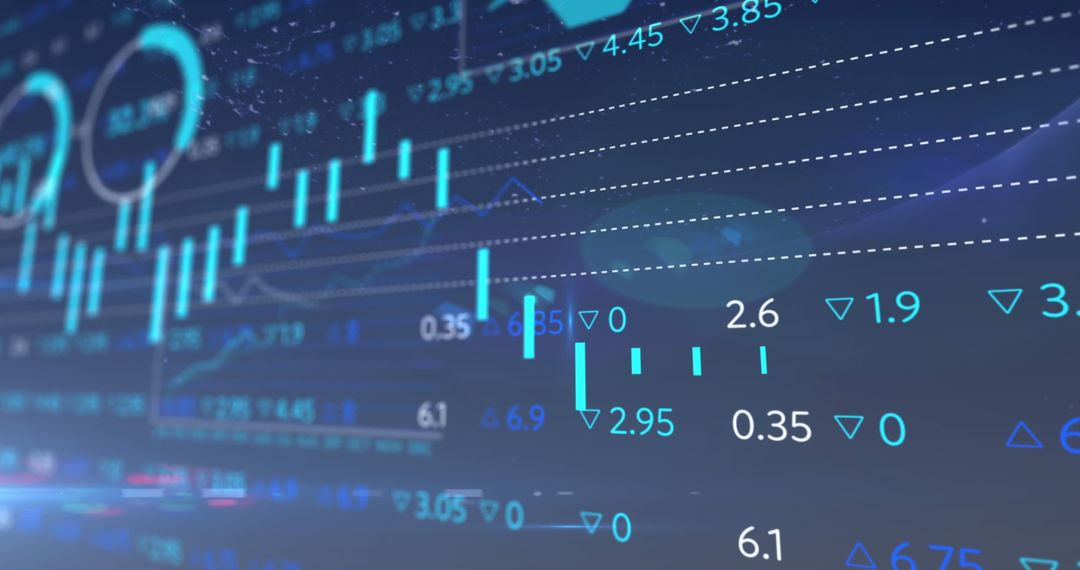
- Futuristic Financial Analysis with Digital Display and Urban Skyline
Futuristic Financial Analysis with Digital Display and Urban Skyline Image

Overlay of dynamic financial graphs on an urban skyline suggests high-tech financial analysis and investment trends. Suitable for use in business presentations, finance workshops, tech marketing, and articles discussing the stock market, investments, and economic analysis, illustrating the interplay between technology and business.
Powered by  - Get 15% off with code: PIKWIZARD15


2
downloads
downloads
Tags:
More
Credit Photo
If you would like to credit the Photo, here are some ways you can do so
Text Link
photo Link
<span class="text-link">
<span>
<a target="_blank" href=https://pikwizard.com/photo/futuristic-financial-analysis-with-digital-display-and-urban-skyline/1e844746e6d493cc493d68d63e5d74f4/>PikWizard</a>
</span>
</span>
<span class="image-link">
<span
style="margin: 0 0 20px 0; display: inline-block; vertical-align: middle; width: 100%;"
>
<a
target="_blank"
href="https://pikwizard.com/photo/futuristic-financial-analysis-with-digital-display-and-urban-skyline/1e844746e6d493cc493d68d63e5d74f4/"
style="text-decoration: none; font-size: 10px; margin: 0;"
>
<img src="https://pikwizard.com/pw/medium/1e844746e6d493cc493d68d63e5d74f4.jpg" style="margin: 0; width: 100%;" alt="" />
<p style="font-size: 12px; margin: 0;">PikWizard</p>
</a>
</span>
</span>
Free (free of charge)
Free for personal and commercial use.
Author: People Creations
Similar Free Stock Images

Premium


Premium


Premium


Premium


Premium


Premium


Premium


Premium


Premium


Premium


Premium


Premium


Premium


Premium


Premium


Premium


Premium


Premium


Premium


Premium


Premium


Premium


Premium


Premium

