- Home >
- Stock Photos >
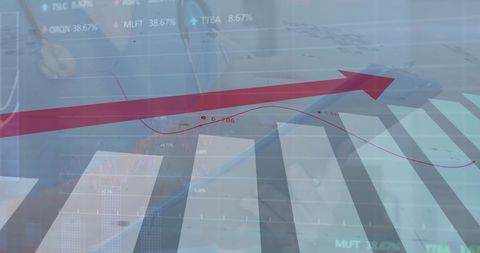
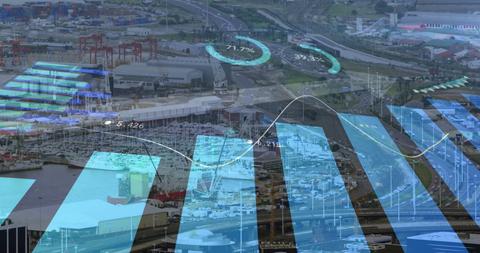
- Futuristic Financial Analytics and Education Background
Futuristic Financial Analytics and Education Background Image

Data visualization overlays financial graphs with mathematical equations in blue, suggesting a fusion of education and analytics. Ideal for illustrating financial education technology, online learning platforms, or future-oriented study materials, and use in financial planning, e-learning, or promotional educational content.

downloads
Tags:
More
Credit Photo
If you would like to credit the Photo, here are some ways you can do so
Text Link
photo Link
<span class="text-link">
<span>
<a target="_blank" href=https://pikwizard.com/photo/futuristic-financial-analytics-and-education-background/f507f313ae115ffe69fca82d7f7c38cf/>PikWizard</a>
</span>
</span>
<span class="image-link">
<span
style="margin: 0 0 20px 0; display: inline-block; vertical-align: middle; width: 100%;"
>
<a
target="_blank"
href="https://pikwizard.com/photo/futuristic-financial-analytics-and-education-background/f507f313ae115ffe69fca82d7f7c38cf/"
style="text-decoration: none; font-size: 10px; margin: 0;"
>
<img src="https://pikwizard.com/pw/medium/f507f313ae115ffe69fca82d7f7c38cf.jpg" style="margin: 0; width: 100%;" alt="" />
<p style="font-size: 12px; margin: 0;">PikWizard</p>
</a>
</span>
</span>
Free (free of charge)
Free for personal and commercial use.
Author: Awesome Content