- Home >
- Stock Photos >
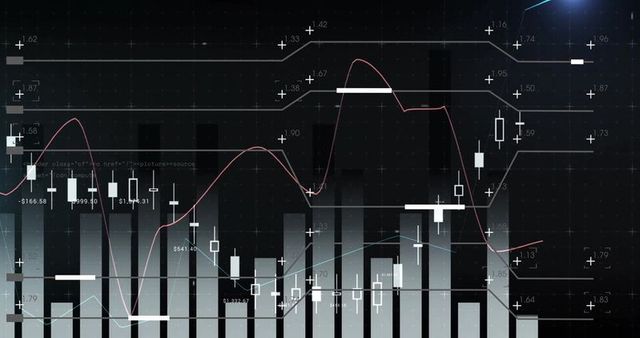
- Futuristic Financial Analytics with Binary Code Streaming
Futuristic Financial Analytics with Binary Code Streaming Image
This image combines elements of financial analysis with high-tech visualization. It includes a digital grid background featuring bars, candlesticks, and binary code along with explanatory data in red and blue lines. Use of this type of detailed visualization suits businesses and financial platforms showcasing technology-forward approaches to data presentation and strategic analysis. Suitable for publications related to financial markets, cryptocurrency trends, or technological innovations within finance sectors. Additionally, it can enhance blog posts or presentations focused on predictive analytics and digital financial solutions.

downloads
Credit Photo
If you would like to credit the Photo, here are some ways you can do so
Free (free of charge)
Free for personal and commercial use.
Author: People Creations