- Home >
- Stock Photos >
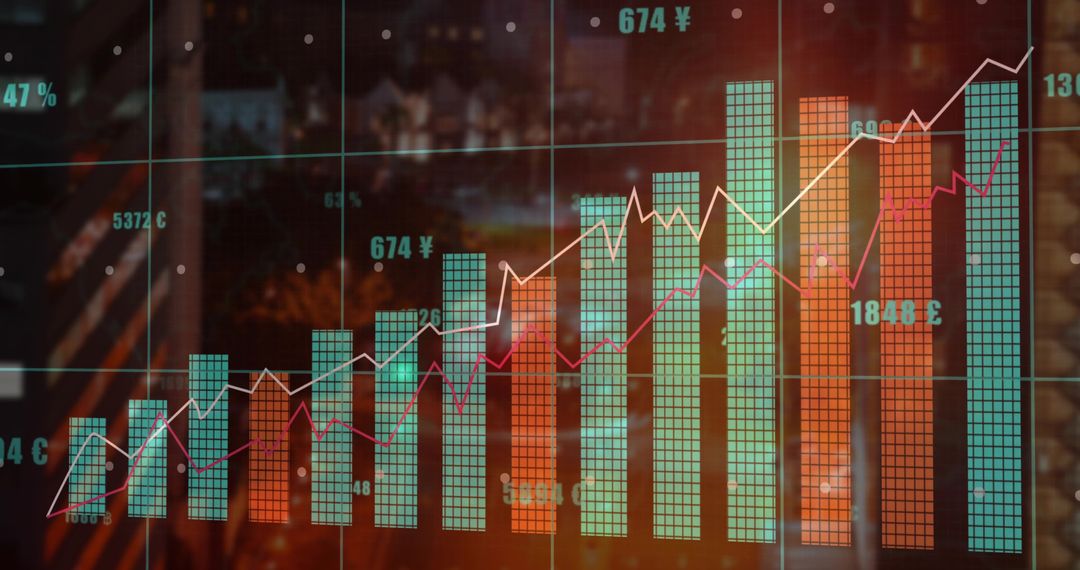
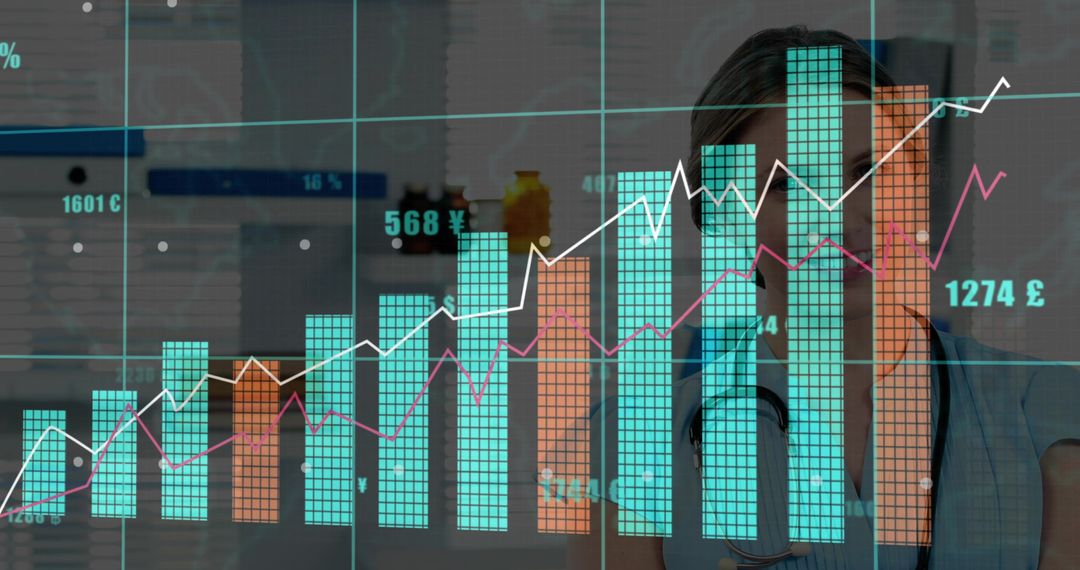
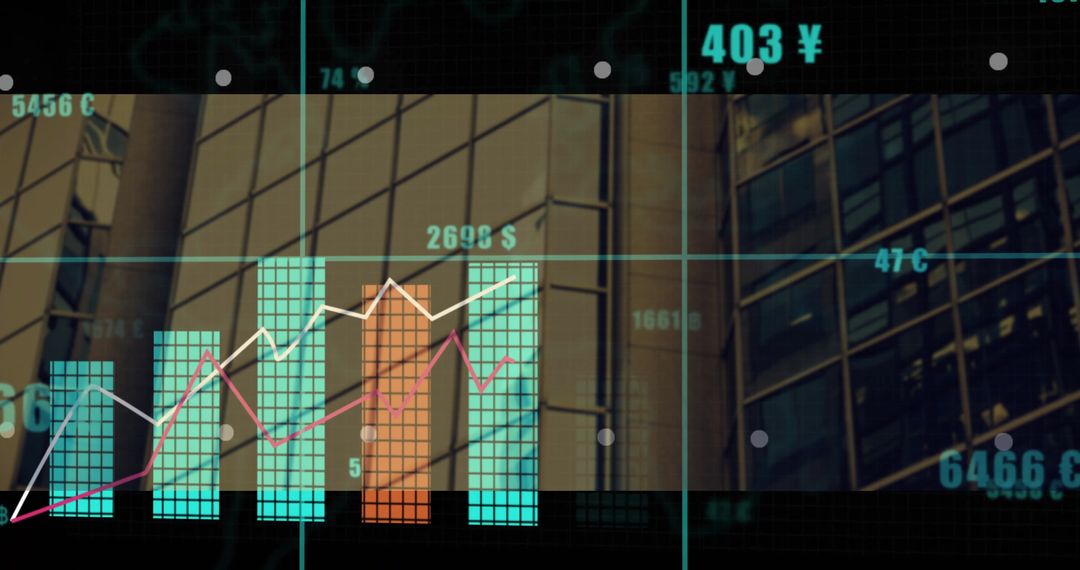
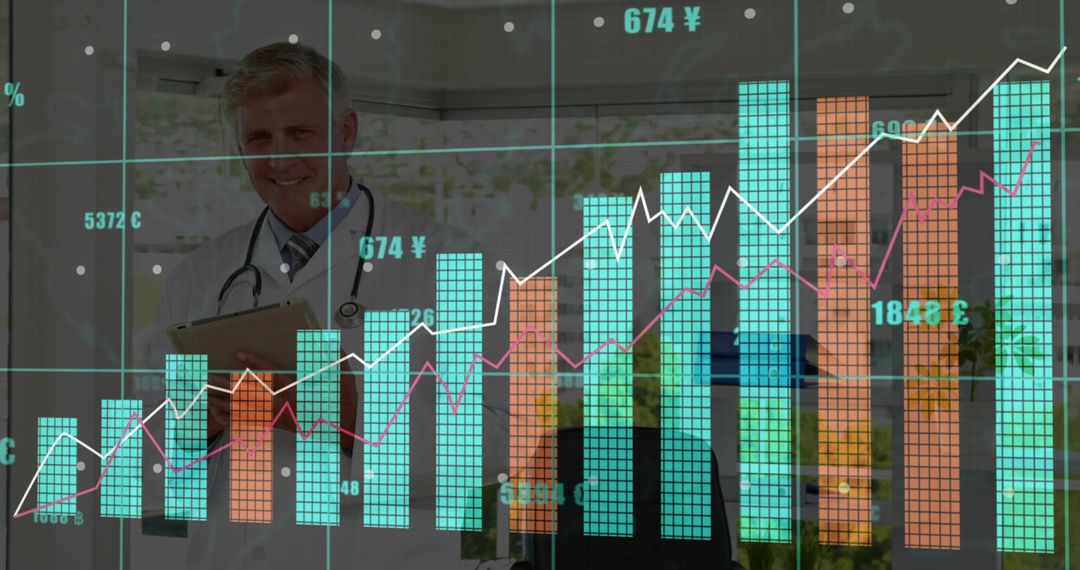
- Futuristic Financial Chart on Glass Display Showing Growth Trends
Futuristic Financial Chart on Glass Display Showing Growth Trends Image

Concept demonstrates modern technology in financial analysis with a visually engaging representation of data trends over a period. Useful for presentations on data analytics, business growth and innovation in corporate settings, emphasizing a futuristic and technological approach to data management.
Powered by  - Get 15% off with code: PIKWIZARD15


0
downloads
downloads
Tags:
More
Credit Photo
If you would like to credit the Photo, here are some ways you can do so
Text Link
photo Link
<span class="text-link">
<span>
<a target="_blank" href=https://pikwizard.com/photo/futuristic-financial-chart-on-glass-display-showing-growth-trends/c3e41f2c7f5c3020408f9c1de1aab4c3/>PikWizard</a>
</span>
</span>
<span class="image-link">
<span
style="margin: 0 0 20px 0; display: inline-block; vertical-align: middle; width: 100%;"
>
<a
target="_blank"
href="https://pikwizard.com/photo/futuristic-financial-chart-on-glass-display-showing-growth-trends/c3e41f2c7f5c3020408f9c1de1aab4c3/"
style="text-decoration: none; font-size: 10px; margin: 0;"
>
<img src="https://pikwizard.com/pw/medium/c3e41f2c7f5c3020408f9c1de1aab4c3.jpg" style="margin: 0; width: 100%;" alt="" />
<p style="font-size: 12px; margin: 0;">PikWizard</p>
</a>
</span>
</span>
Free (free of charge)
Free for personal and commercial use.
Author: Awesome Content
Similar Free Stock Images

Premium


Premium


Premium


Premium


Premium


Premium


Premium


Premium


Premium


Premium


Premium


Premium


Premium


Premium


Premium


Premium


Premium


Premium


Premium


Premium


Premium


Premium


Premium


Premium