
- Home >
- Stock Photos >
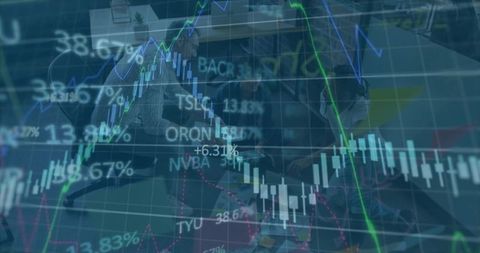
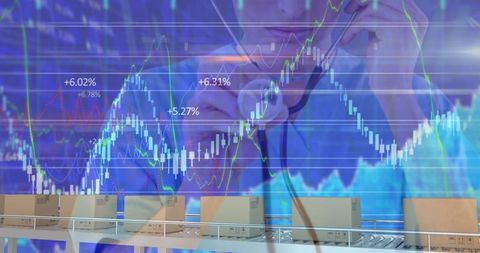
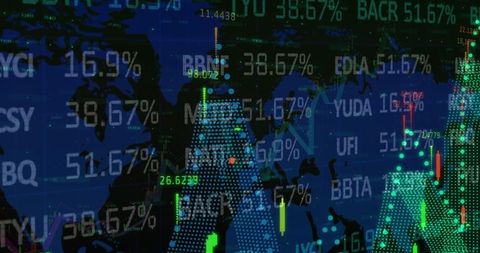
- Futuristic Financial Chart With Geometric Tunnel and Data Visualization
Futuristic Financial Chart With Geometric Tunnel and Data Visualization Image
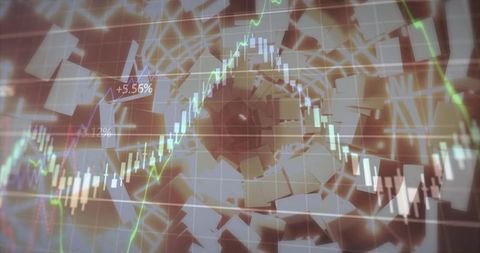
Abstract visualization featuring a digital financial chart within a geometric tunnel. Candlesticks and line graphs highlight stock market data, with a noted increase of 5.56%. Useful for illustrating finance technology advancements, market analytics, economic forecast reports, and modern financial marketing materials.
Powered by  - Get 15% off with code: PIKWIZARD15


downloads
Tags:
More
Credit Photo
If you would like to credit the Photo, here are some ways you can do so
Text Link
photo Link
<span class="text-link">
<span>
<a target="_blank" href=https://pikwizard.com/photo/futuristic-financial-chart-with-geometric-tunnel-and-data-visualization/3ced2d7c63cacdfb3329ae927a6486ee/>PikWizard</a>
</span>
</span>
<span class="image-link">
<span
style="margin: 0 0 20px 0; display: inline-block; vertical-align: middle; width: 100%;"
>
<a
target="_blank"
href="https://pikwizard.com/photo/futuristic-financial-chart-with-geometric-tunnel-and-data-visualization/3ced2d7c63cacdfb3329ae927a6486ee/"
style="text-decoration: none; font-size: 10px; margin: 0;"
>
<img src="https://pikwizard.com/pw/medium/3ced2d7c63cacdfb3329ae927a6486ee.jpg" style="margin: 0; width: 100%;" alt="" />
<p style="font-size: 12px; margin: 0;">PikWizard</p>
</a>
</span>
</span>
Free (free of charge)
Free for personal and commercial use.
Author: Awesome Content
Similar Free Stock Images

Premium


Premium


Premium


Premium


Premium

Premium


Premium


Premium


Premium

Premium


Premium


Premium


Premium

Premium


Premium


Premium

Premium


Premium


Premium

Premium


Premium


Premium


Premium


Premium


Premium


Explore More Free Stock Images