
- Home >
- Stock Photos >
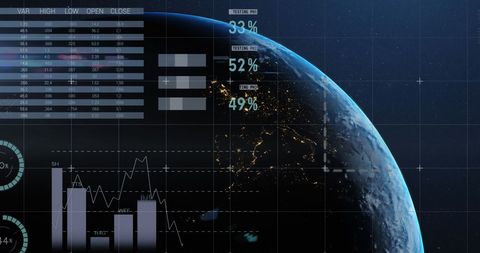
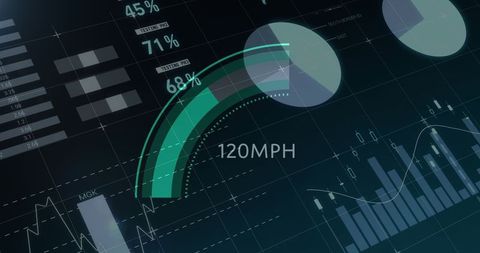
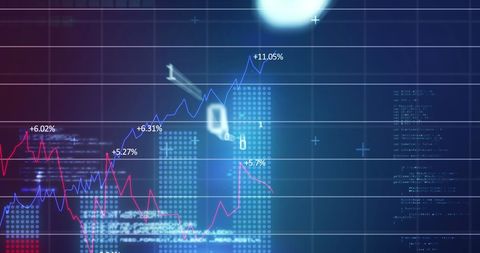
- Futuristic Financial Charts on Digital Interface Background
Futuristic Financial Charts on Digital Interface Background Image

Stylized digital backdrop featuring various financial charts and graphs on a sleek interface. Utilize it for presentations on finance, business analytics, investment trends, and technology impact on financial markets. Perfect choice for conveying avant-garde financial analysis tools and dynamic data insights.
Powered by  - Get 15% off with code: PIKWIZARD15


Credit Photo
If you would like to credit the Photo, here are some ways you can do so
Text Link
photo Link
<span class="text-link">
<span>
<a target="_blank" href=https://pikwizard.com/photo/futuristic-financial-charts-on-digital-interface-background/d78b936ae00a4532e705142895080754/>PikWizard</a>
</span>
</span>
<span class="image-link">
<span
style="margin: 0 0 20px 0; display: inline-block; vertical-align: middle; width: 100%;"
>
<a
target="_blank"
href="https://pikwizard.com/photo/futuristic-financial-charts-on-digital-interface-background/d78b936ae00a4532e705142895080754/"
style="text-decoration: none; font-size: 10px; margin: 0;"
>
<img src="https://pikwizard.com/pw/medium/d78b936ae00a4532e705142895080754.jpg" style="margin: 0; width: 100%;" alt="" />
<p style="font-size: 12px; margin: 0;">PikWizard</p>
</a>
</span>
</span>
Free (free of charge)
Free for personal and commercial use.
Author: People Creations
Similar Free Stock Images

Premium


Premium


Premium


Premium


Premium


Premium


Premium


Premium


Premium


Premium


Premium


Premium


Premium


Premium


Premium


Premium


Premium


Premium


Premium

Premium


Premium


Premium

Premium


Premium


Premium


Explore More Free Stock Images