- Home >
- Stock Photos >
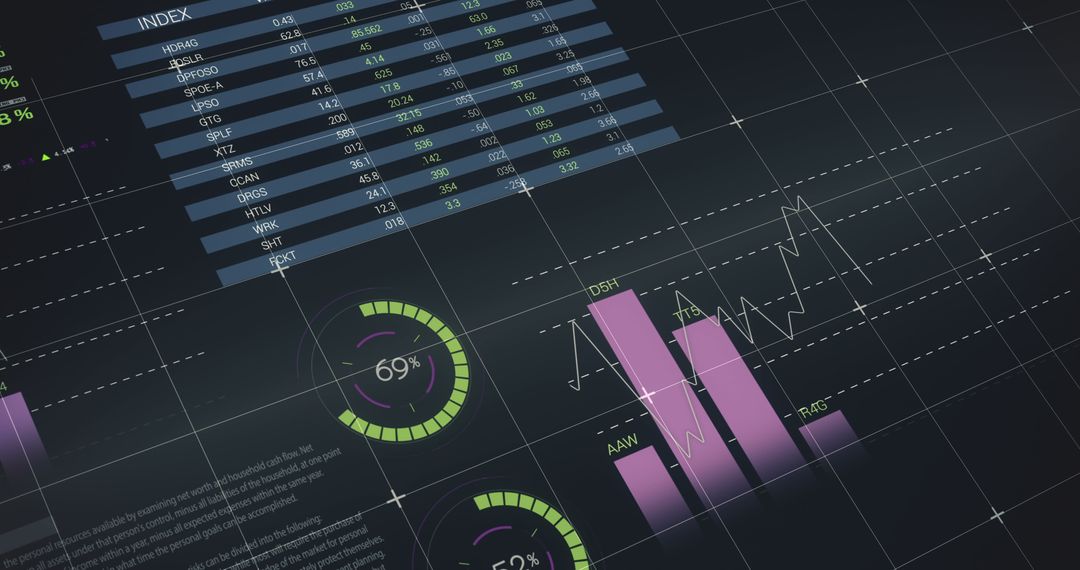
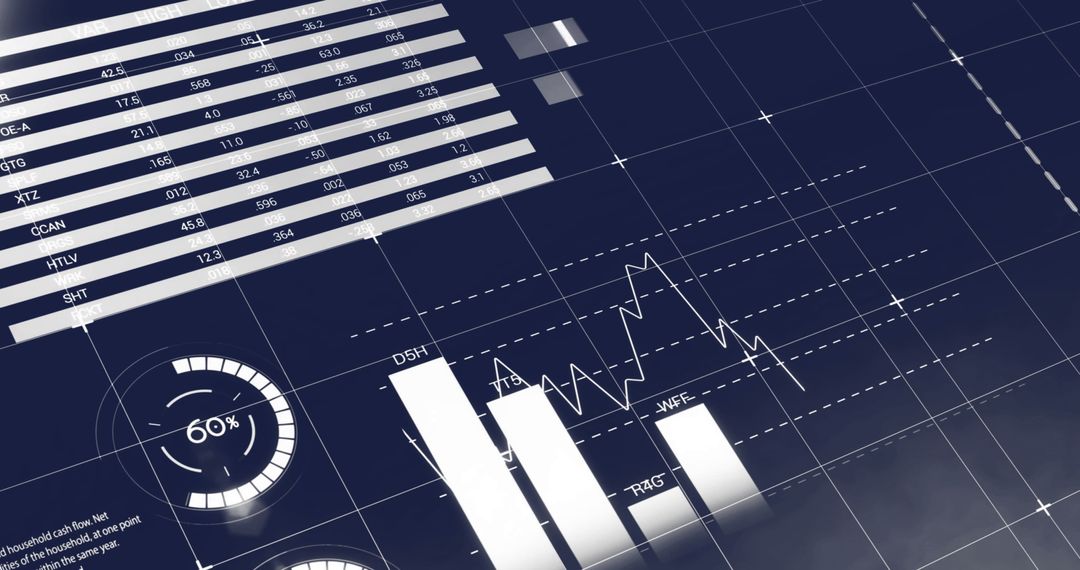
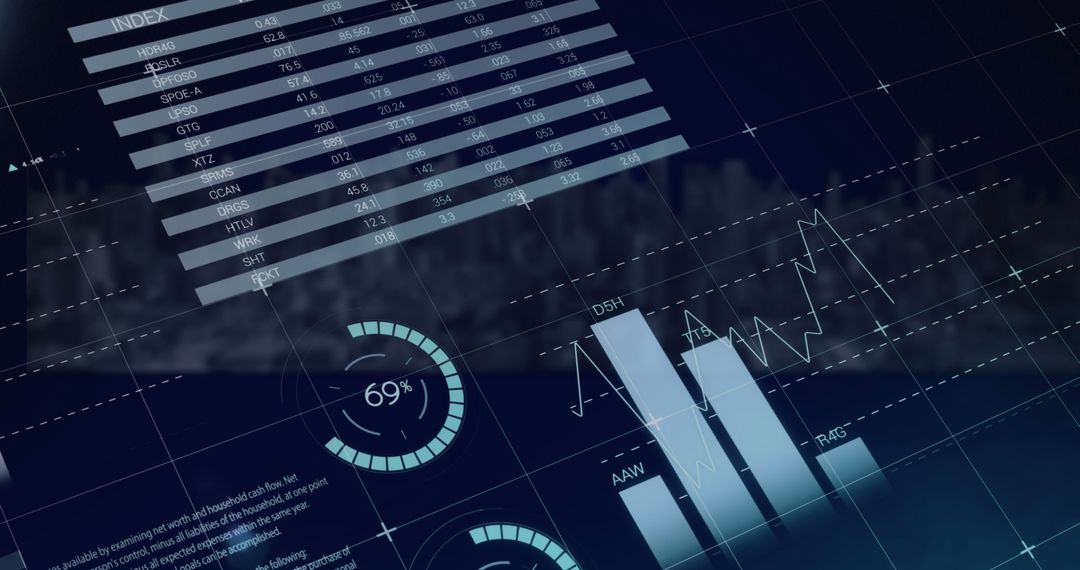
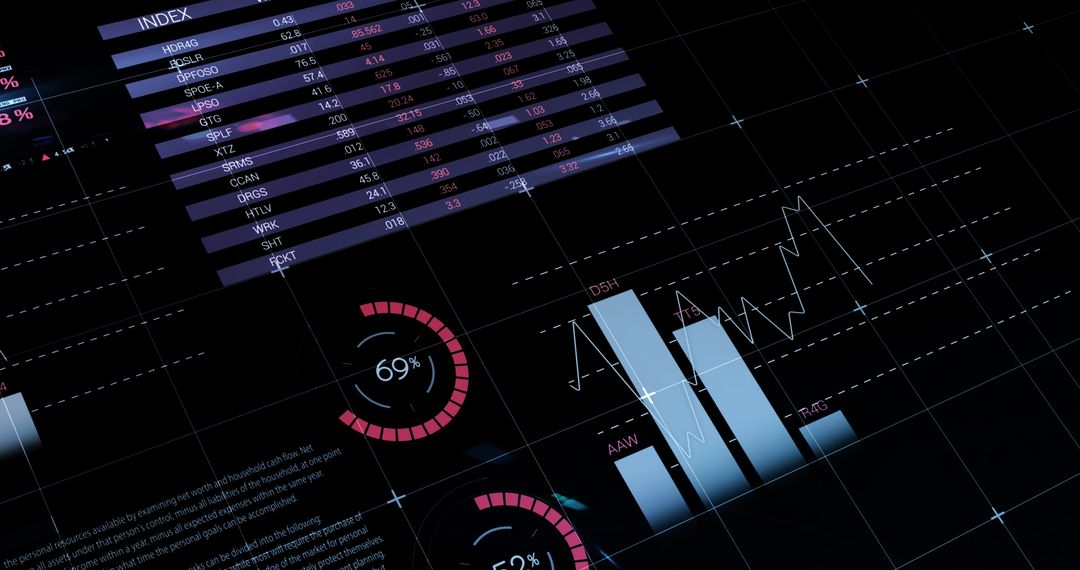
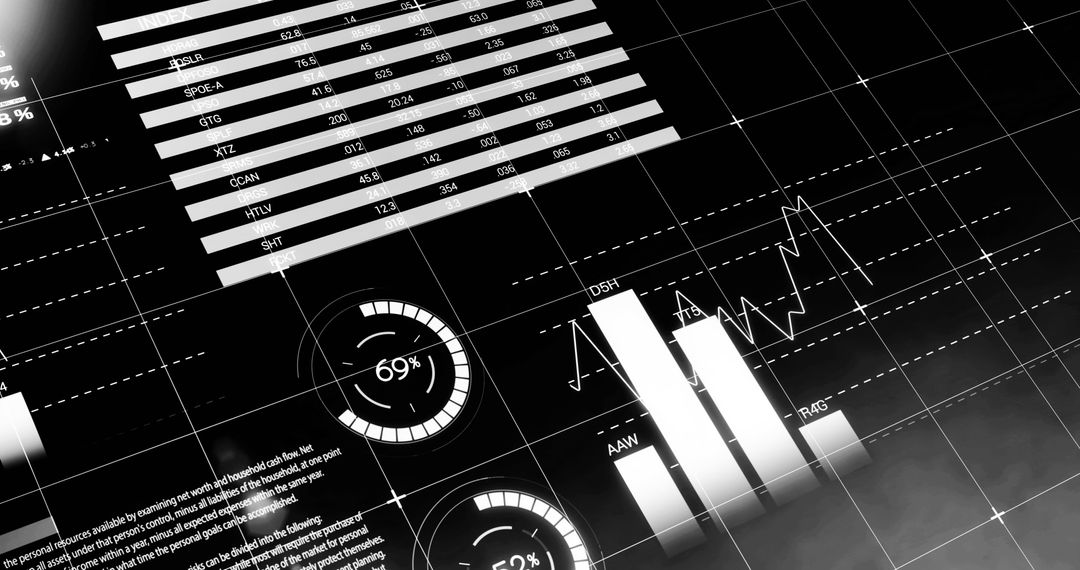
- Futuristic Financial Dashboard Displaying Analytics Gauges, Bar Charts and Line Trends
Futuristic Financial Dashboard Displaying Analytics Gauges, Bar Charts and Line Trends Image

Presenting layered dashboard elements including index table, circular gauge reading 69 percent, vertical bar chart and neon green trend line over grid background. Suiting fintech presentations, investor reports, corporate analytics slides, website hero banners and marketing campaigns. Working well as background for UI mockups, app prototypes, data storytelling, social media posts and blog headers. Conveying modern high-tech mood with dark gradient, neon accents and geometric grid lines. Providing editable overlay space for adding logos, headlines and KPI callouts.
Powered by  - Get 15% off with code: PIKWIZARD15


0
downloads
downloads
Tags:
More
Credit Photo
If you would like to credit the Photo, here are some ways you can do so
Text Link
photo Link
<span class="text-link">
<span>
<a target="_blank" href=https://pikwizard.com/photo/futuristic-financial-dashboard-displaying-analytics-gauges-bar-charts-and-line-trends/24d2af734aeae445818d0c6c9be6f89e/>PikWizard</a>
</span>
</span>
<span class="image-link">
<span
style="margin: 0 0 20px 0; display: inline-block; vertical-align: middle; width: 100%;"
>
<a
target="_blank"
href="https://pikwizard.com/photo/futuristic-financial-dashboard-displaying-analytics-gauges-bar-charts-and-line-trends/24d2af734aeae445818d0c6c9be6f89e/"
style="text-decoration: none; font-size: 10px; margin: 0;"
>
<img src="https://pikwizard.com/pw/medium/24d2af734aeae445818d0c6c9be6f89e.jpg" style="margin: 0; width: 100%;" alt="" />
<p style="font-size: 12px; margin: 0;">PikWizard</p>
</a>
</span>
</span>
Free (free of charge)
Free for personal and commercial use.
Author: Authentic Images
Similar Free Stock Images

Premium


Premium


Premium


Premium


Premium


Premium


Premium


Premium


Premium


Premium


Premium


Premium


Premium


Premium


Premium


Premium


Premium


Premium


Premium


Premium


Premium


Premium


Premium


Premium