
- Home >
- Stock Photos >
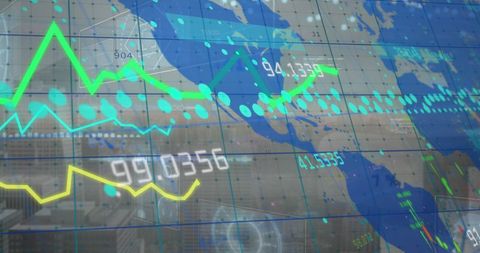
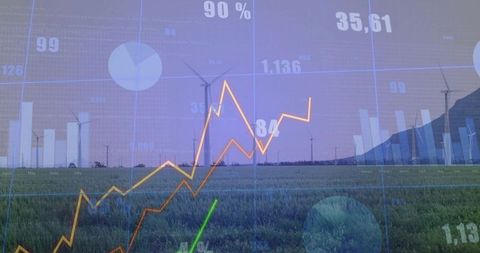
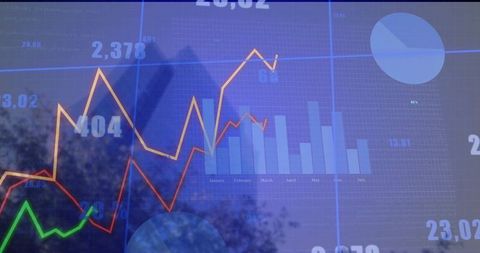
- Futuristic Financial Dashboard Displaying Data Analytics
Futuristic Financial Dashboard Displaying Data Analytics Image

Numerous line and bar charts are displayed on a high-tech digital dashboard, providing insights into financial data analytics. Shows numeric data and visual representations prominently. Suitable for illustrating concepts of business analytics, modern finance technology, investment tracking, and data management solutions in presentations or websites focusing on future-forward finance strategies.
Powered by 


downloads
Tags:
More
Credit Photo
If you would like to credit the Photo, here are some ways you can do so
Text Link
photo Link
<span class="text-link">
<span>
<a target="_blank" href=https://pikwizard.com/photo/futuristic-financial-dashboard-displaying-data-analytics/c0c452db8439e09bb9e19d9f41cddd04/>PikWizard</a>
</span>
</span>
<span class="image-link">
<span
style="margin: 0 0 20px 0; display: inline-block; vertical-align: middle; width: 100%;"
>
<a
target="_blank"
href="https://pikwizard.com/photo/futuristic-financial-dashboard-displaying-data-analytics/c0c452db8439e09bb9e19d9f41cddd04/"
style="text-decoration: none; font-size: 10px; margin: 0;"
>
<img src="https://pikwizard.com/pw/medium/c0c452db8439e09bb9e19d9f41cddd04.jpg" style="margin: 0; width: 100%;" alt="" />
<p style="font-size: 12px; margin: 0;">PikWizard</p>
</a>
</span>
</span>
Free (free of charge)
Free for personal and commercial use.
Author: People Creations
Similar Free Stock Images

Premium


Premium

Premium


Premium


Premium


Premium


Premium


Premium

Premium


Premium


Premium


Premium


Premium


Premium


Premium


Premium


Premium


Premium

Premium


Premium

Premium


Premium


Premium


Premium


Premium


Explore More Free Stock Images