
- Home >
- Stock Photos >
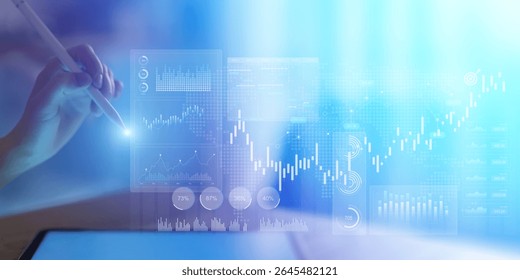
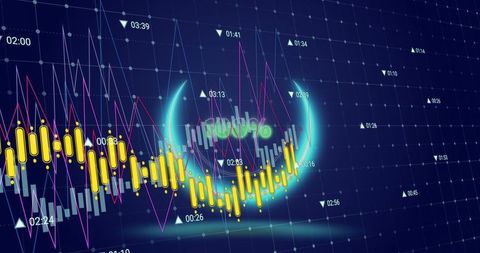
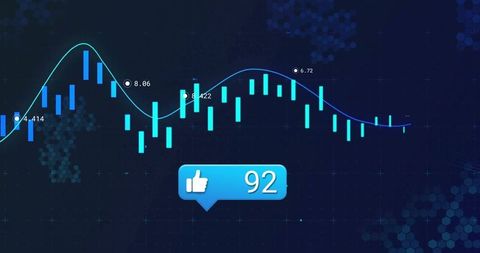
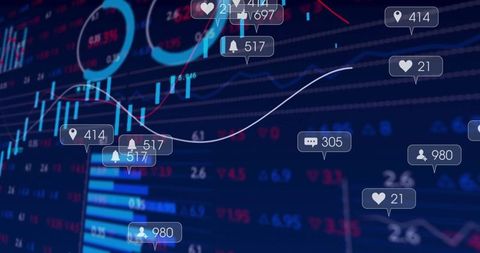
- Futuristic Financial Dashboard Displaying Interactive Data Graph
Futuristic Financial Dashboard Displaying Interactive Data Graph Image

Showcasing futuristic design of a trading platform screen displaying dynamic data visualization with line graphs and bars, supported by interactive notifications. Useful for illustrating innovative financial monitoring tools in presentations, articles on stock market analytics, website designs for fintech platforms, and modern financial technology applications.
Powered by  - Get 15% off with code: PIKWIZARD15


downloads
Tags:
More
Credit Photo
If you would like to credit the Photo, here are some ways you can do so
Text Link
photo Link
<span class="text-link">
<span>
<a target="_blank" href=https://pikwizard.com/photo/futuristic-financial-dashboard-displaying-interactive-data-graph/cf97372621d31a0142b5cd6a9b27aaa8/>PikWizard</a>
</span>
</span>
<span class="image-link">
<span
style="margin: 0 0 20px 0; display: inline-block; vertical-align: middle; width: 100%;"
>
<a
target="_blank"
href="https://pikwizard.com/photo/futuristic-financial-dashboard-displaying-interactive-data-graph/cf97372621d31a0142b5cd6a9b27aaa8/"
style="text-decoration: none; font-size: 10px; margin: 0;"
>
<img src="https://pikwizard.com/pw/medium/cf97372621d31a0142b5cd6a9b27aaa8.jpg" style="margin: 0; width: 100%;" alt="" />
<p style="font-size: 12px; margin: 0;">PikWizard</p>
</a>
</span>
</span>
Free (free of charge)
Free for personal and commercial use.
Author: Creative Art
Similar Free Stock Images

Premium


Premium

Premium


Premium


Premium

Premium


Premium

Premium


Premium


Premium


Premium


Premium
Premium

Premium


Premium

Premium

Premium


Premium


Premium

Premium


Premium


Premium


Premium


Premium

Premium


Explore More Free Stock Images