
- Home >
- Stock Photos >
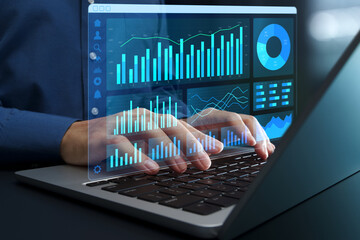
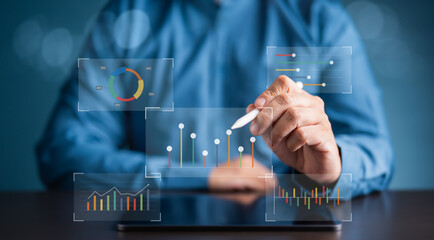
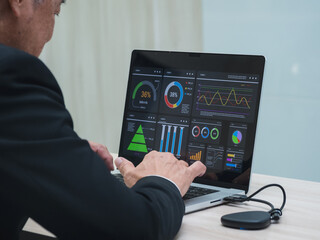
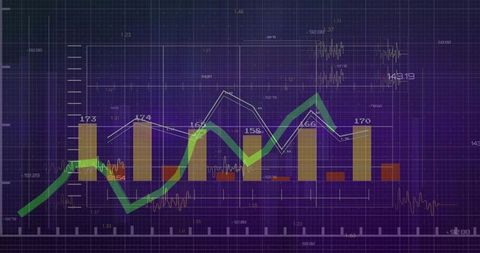
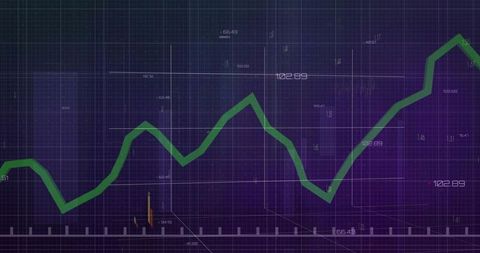
- Futuristic Financial Dashboard with Analytics and Data Visualization
Futuristic Financial Dashboard with Analytics and Data Visualization Image

This representation of financial analytics with a dark UI is designed for technology-focused purposes. Useful for presentations about investments, technology in finance, educational content about data analysis, stock market simulations, and demonstrating modern tools in virtual dashboards. Professional presentations can benefit from the futuristic and tech-savvy aesthetic.
Powered by 


downloads
Tags:
More
Credit Photo
If you would like to credit the Photo, here are some ways you can do so
Text Link
photo Link
<span class="text-link">
<span>
<a target="_blank" href=https://pikwizard.com/photo/futuristic-financial-dashboard-with-analytics-and-data-visualization/c1b72cb258e13feb4f6c648c6240a88b/>PikWizard</a>
</span>
</span>
<span class="image-link">
<span
style="margin: 0 0 20px 0; display: inline-block; vertical-align: middle; width: 100%;"
>
<a
target="_blank"
href="https://pikwizard.com/photo/futuristic-financial-dashboard-with-analytics-and-data-visualization/c1b72cb258e13feb4f6c648c6240a88b/"
style="text-decoration: none; font-size: 10px; margin: 0;"
>
<img src="https://pikwizard.com/pw/medium/c1b72cb258e13feb4f6c648c6240a88b.jpg" style="margin: 0; width: 100%;" alt="" />
<p style="font-size: 12px; margin: 0;">PikWizard</p>
</a>
</span>
</span>
Free (free of charge)
Free for personal and commercial use.
Author: Awesome Content
Similar Free Stock Images

Premium


Premium

Premium


Premium


Premium

Premium


Premium
Premium


Premium


Premium

Premium

Premium


Premium


Premium

Premium


Premium

Premium


Premium


Premium


Premium


Premium


Premium
Premium


Premium

Premium


Explore More Free Stock Images