- Home >
- Stock Photos >
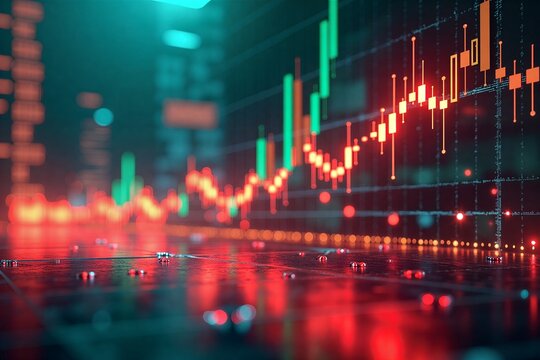
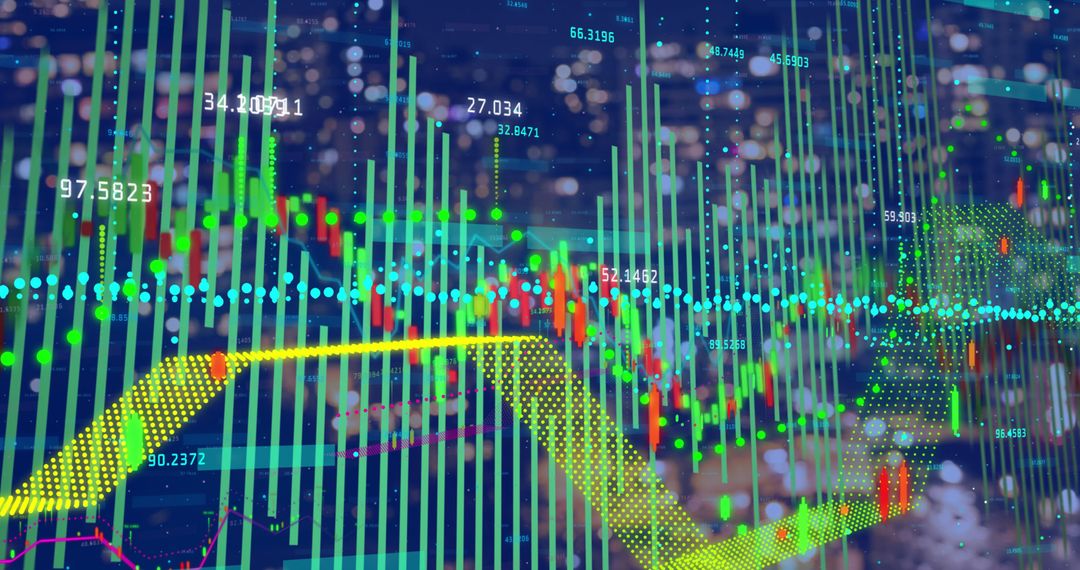
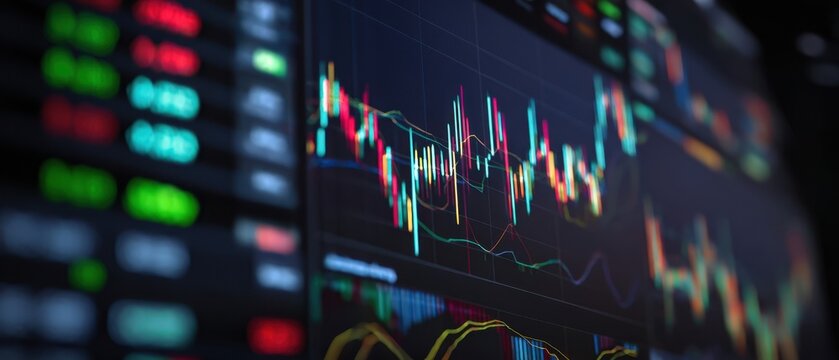
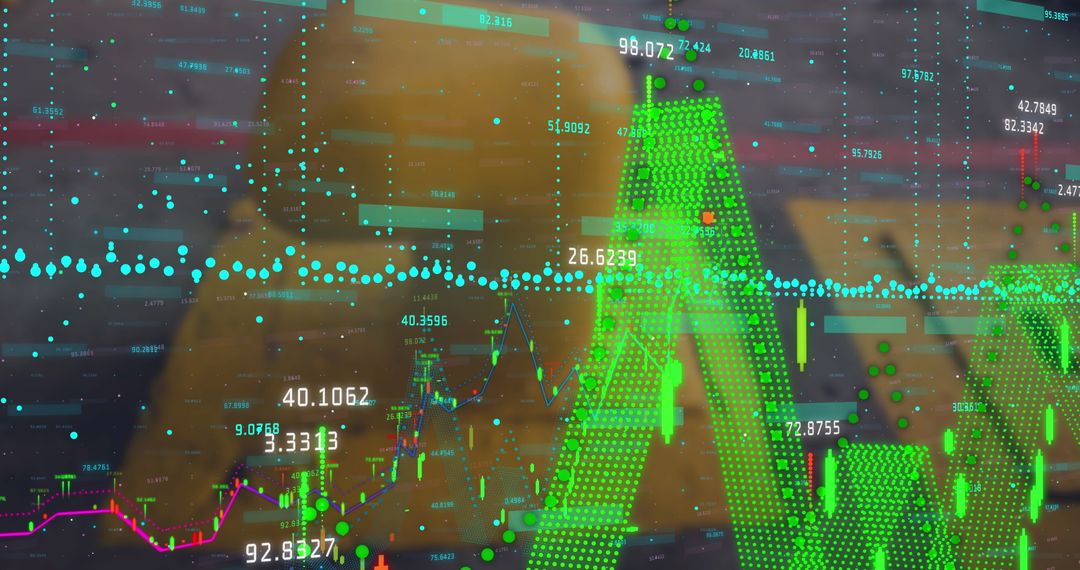
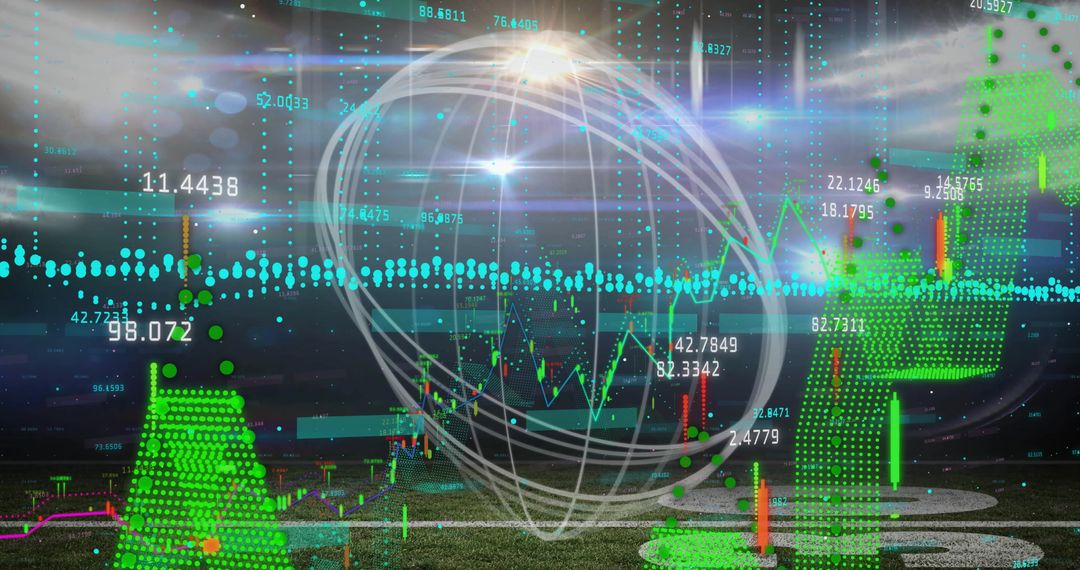
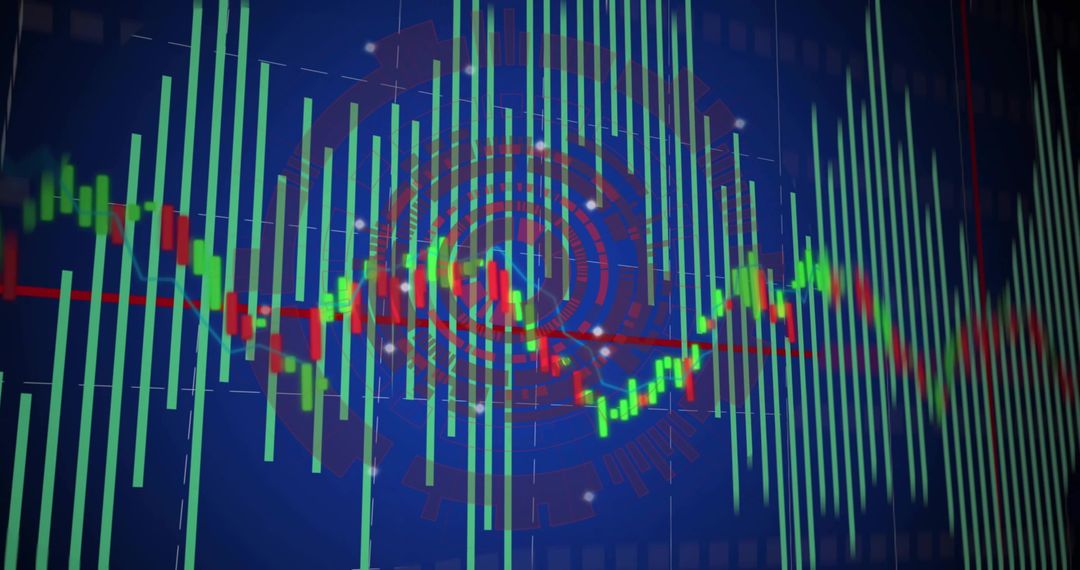
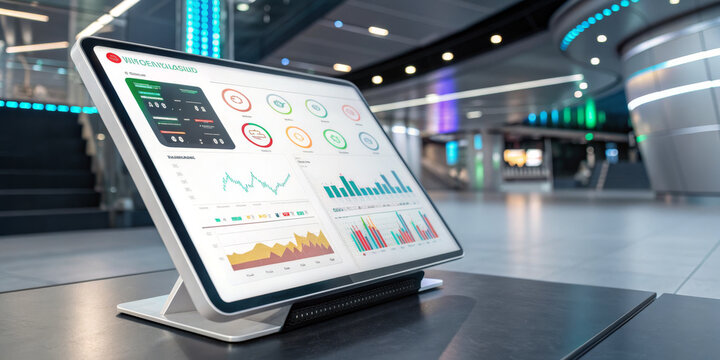
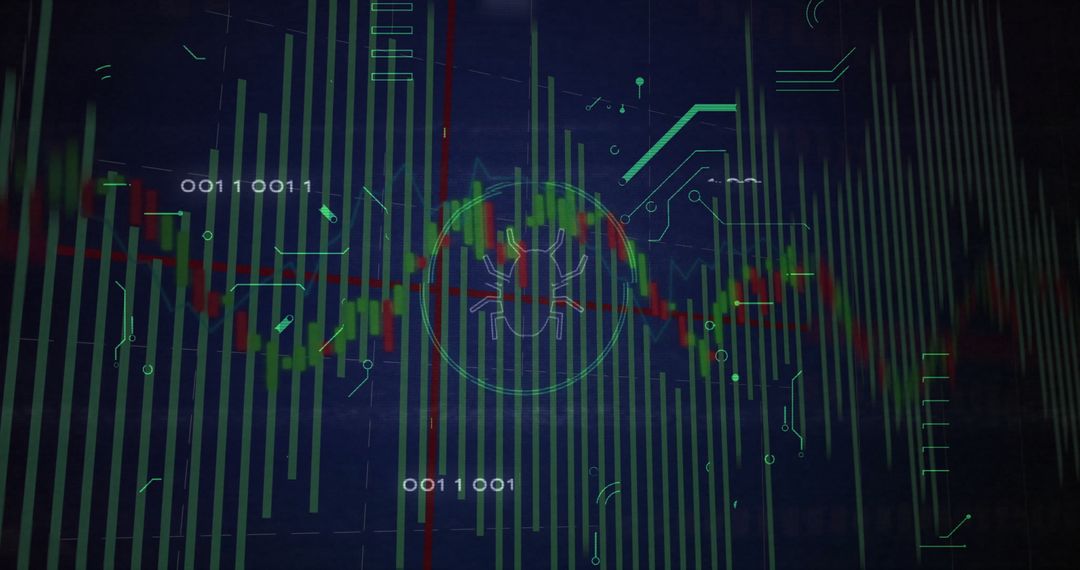
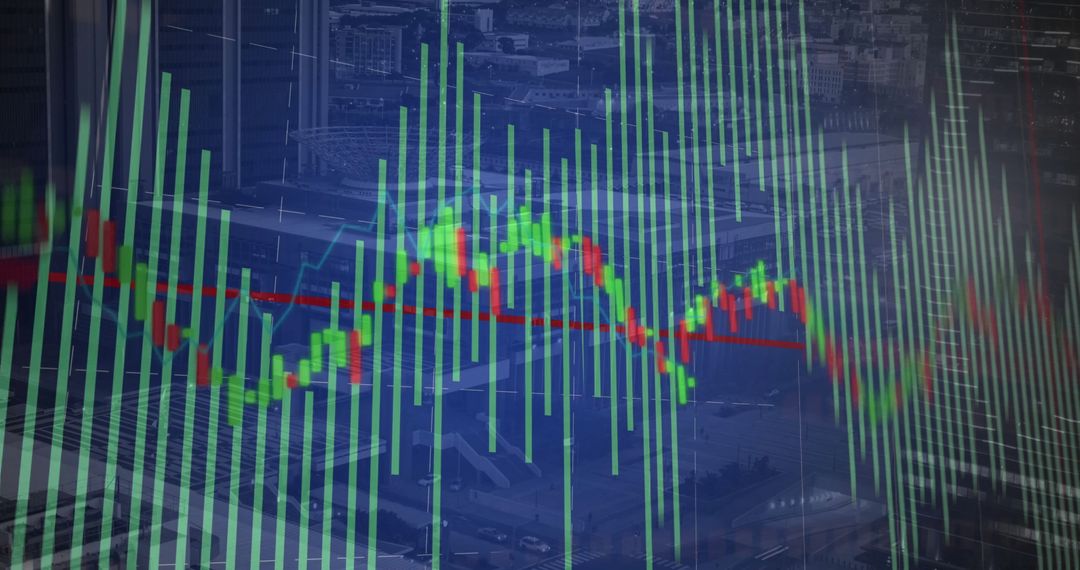
- Futuristic Financial Dashboard with Bar and Candlestick Patterns
Futuristic Financial Dashboard with Bar and Candlestick Patterns Image

Illustrates digital financial analytics with emphasis on bar and candlestick charts, suggesting an advanced trading system interface. Ideal for presentations on markets, trading practices, investment strategies, and economic trends to captivate professionals and enthusiastic audiences alike.
Powered by 


0
downloads
downloads
Tags:
More
Credit Photo
If you would like to credit the Photo, here are some ways you can do so
Text Link
photo Link
<span class="text-link">
<span>
<a target="_blank" href=https://pikwizard.com/photo/futuristic-financial-dashboard-with-bar-and-candlestick-patterns/43812defb004cc2ad99588bc256342b4/>PikWizard</a>
</span>
</span>
<span class="image-link">
<span
style="margin: 0 0 20px 0; display: inline-block; vertical-align: middle; width: 100%;"
>
<a
target="_blank"
href="https://pikwizard.com/photo/futuristic-financial-dashboard-with-bar-and-candlestick-patterns/43812defb004cc2ad99588bc256342b4/"
style="text-decoration: none; font-size: 10px; margin: 0;"
>
<img src="https://pikwizard.com/pw/medium/43812defb004cc2ad99588bc256342b4.jpg" style="margin: 0; width: 100%;" alt="" />
<p style="font-size: 12px; margin: 0;">PikWizard</p>
</a>
</span>
</span>
Free (free of charge)
Free for personal and commercial use.
Author: People Creations
Similar Free Stock Images
Premium


Premium


Premium


Premium


Premium


Premium


Premium


Premium


Premium


Premium


Premium


Premium


Premium


Premium


Premium


Premium


Premium


Premium


Premium


Premium


Premium


Premium


Premium
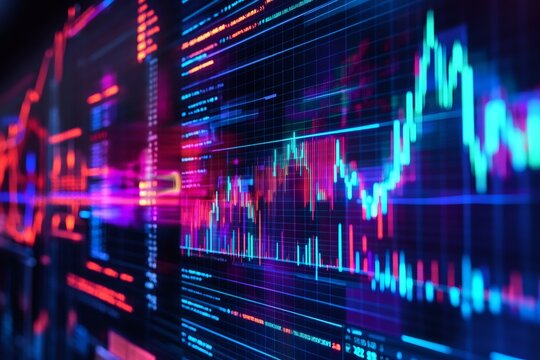
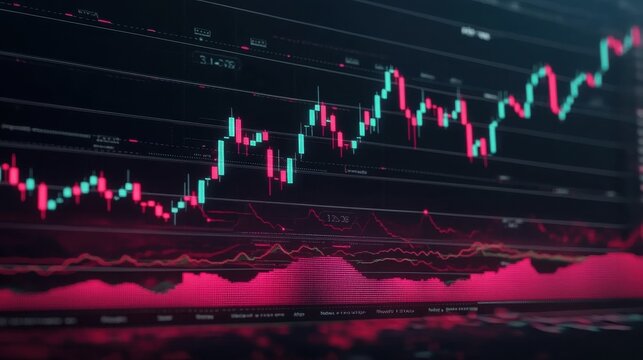
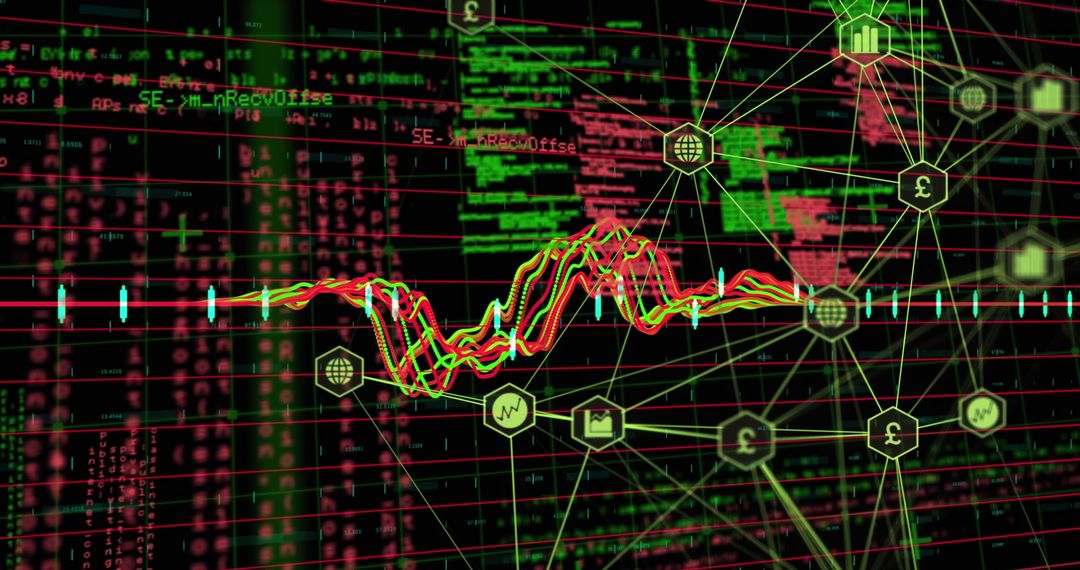
![[The candlestick market chart showcasing glowing red and teal financial data trends]](https://t4.ftcdn.net/jpg/16/64/42/45/360_F_1664424501_Hj640qQUHex2AWpGogVUXEtDoPk9LhJy.jpg)


Premium