- Home >
- Stock Photos >
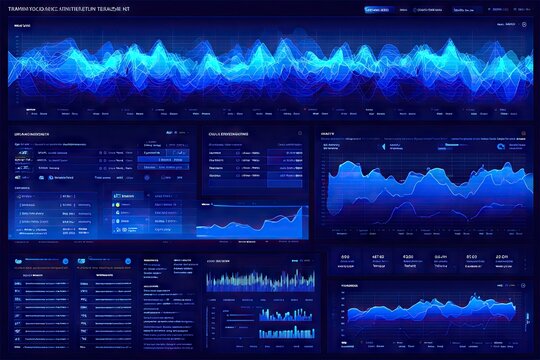
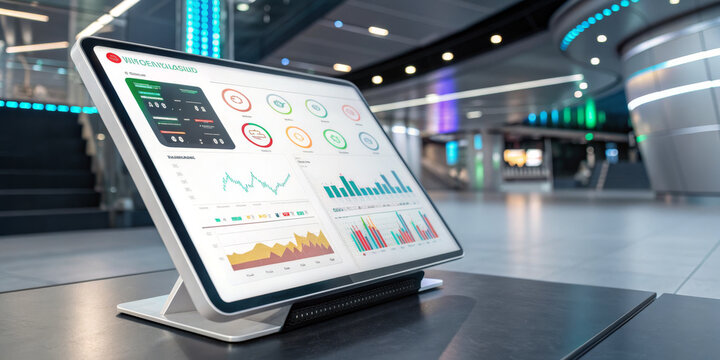
- Futuristic Financial Dashboard with Dynamic Stock Market Graphs
Futuristic Financial Dashboard with Dynamic Stock Market Graphs Image

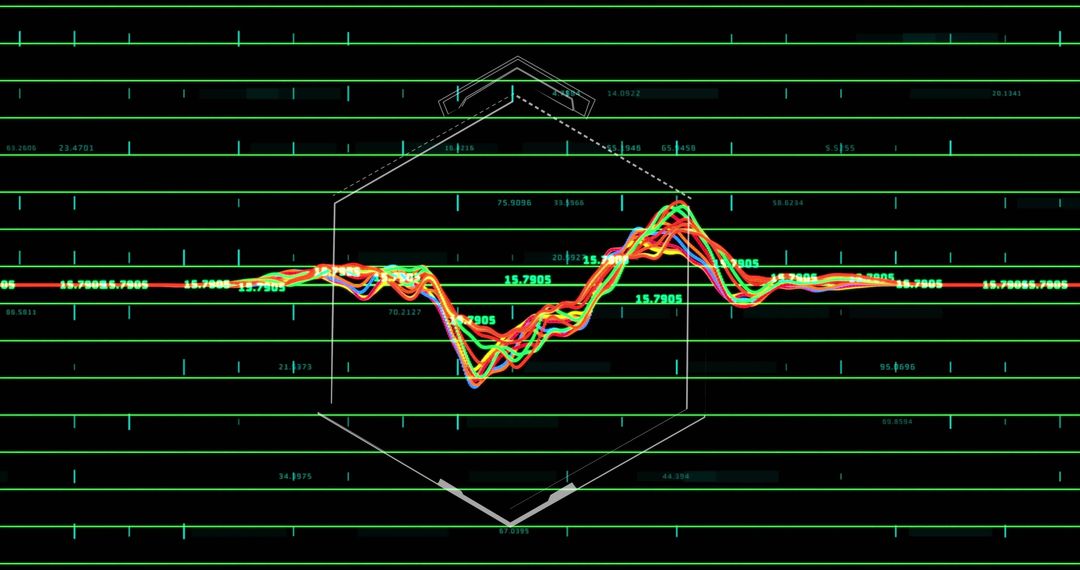
The visual showcases a high-tech financial dashboard, featuring oscillating line graphs over a gridline background with various stock ticker symbols and numeric labels. This modern interface exemplifies the use of data visualization technology in financial markets, providing analytical insights. Perfect for content related to finance, trading platforms, investment tutorials, and presentations on market analysis.
Powered by 


0
downloads
downloads
Tags:
More
Credit Photo
If you would like to credit the Photo, here are some ways you can do so
Text Link
photo Link
<span class="text-link">
<span>
<a target="_blank" href=https://pikwizard.com/photo/futuristic-financial-dashboard-with-dynamic-stock-market-graphs/410c881928cbcbdd649e346293d7b972/>PikWizard</a>
</span>
</span>
<span class="image-link">
<span
style="margin: 0 0 20px 0; display: inline-block; vertical-align: middle; width: 100%;"
>
<a
target="_blank"
href="https://pikwizard.com/photo/futuristic-financial-dashboard-with-dynamic-stock-market-graphs/410c881928cbcbdd649e346293d7b972/"
style="text-decoration: none; font-size: 10px; margin: 0;"
>
<img src="https://pikwizard.com/pw/medium/410c881928cbcbdd649e346293d7b972.jpg" style="margin: 0; width: 100%;" alt="" />
<p style="font-size: 12px; margin: 0;">PikWizard</p>
</a>
</span>
</span>
Free (free of charge)
Free for personal and commercial use.
Author: People Creations
Similar Free Stock Images

Premium


Premium


Premium


Premium


Premium


Premium


Premium


Premium


Premium


Premium


Premium


Premium


Premium


Premium


Premium


Premium


Premium


Premium


Premium


Premium


Premium


Premium


Premium


Premium