
- Home >
- Stock Photos >
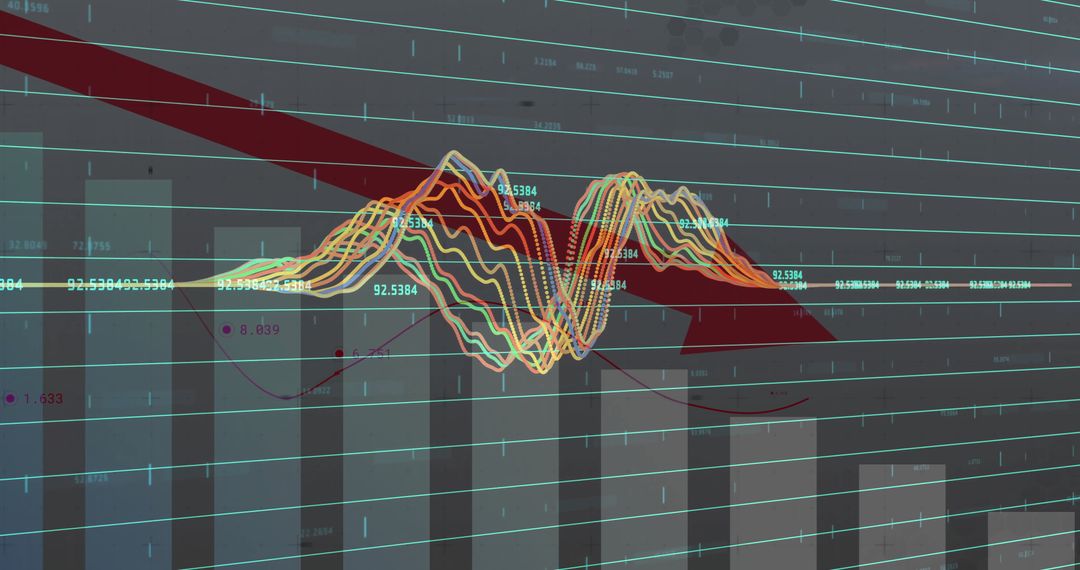
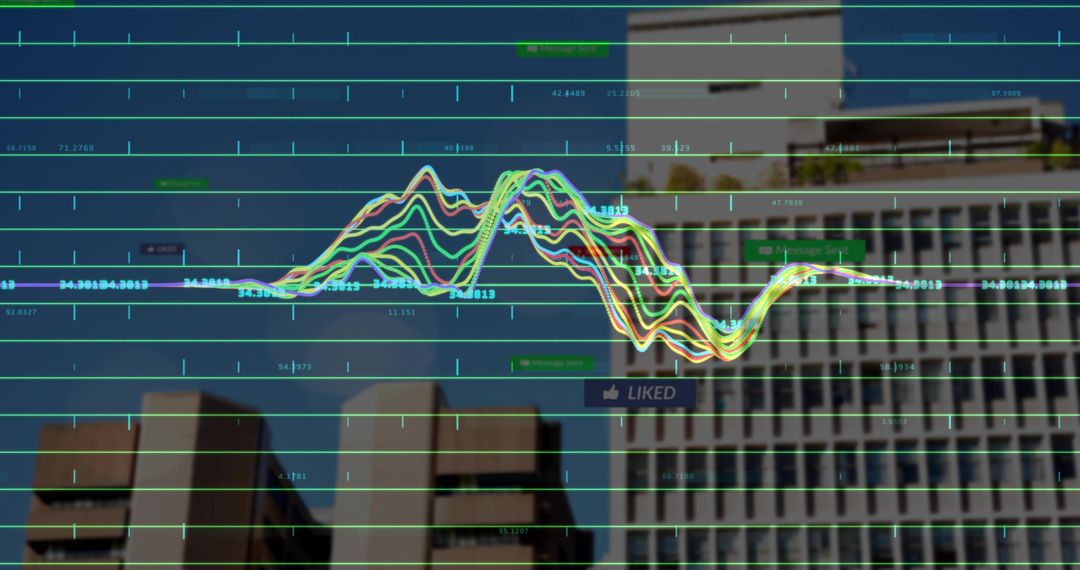
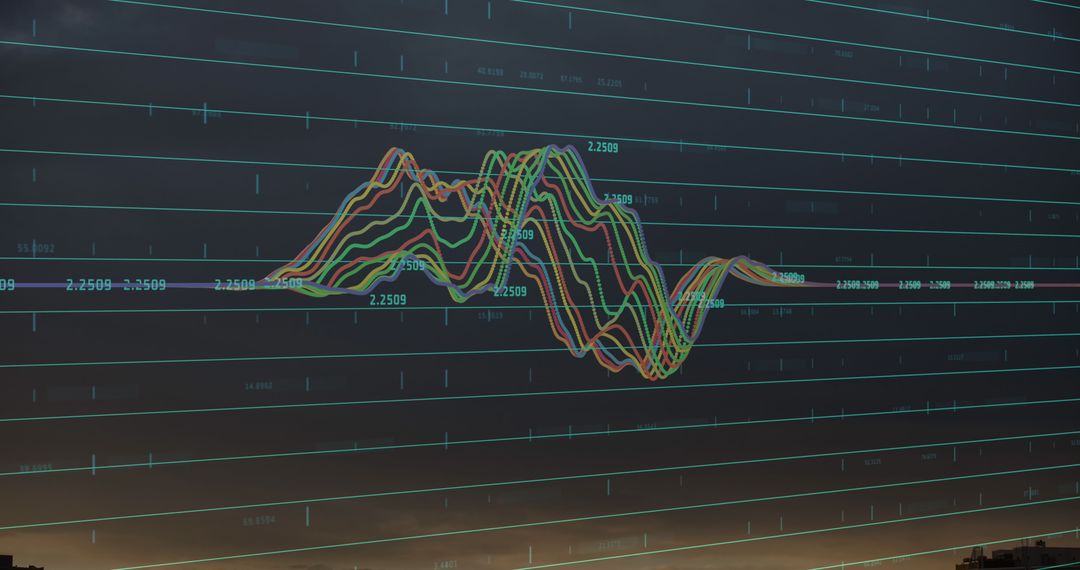
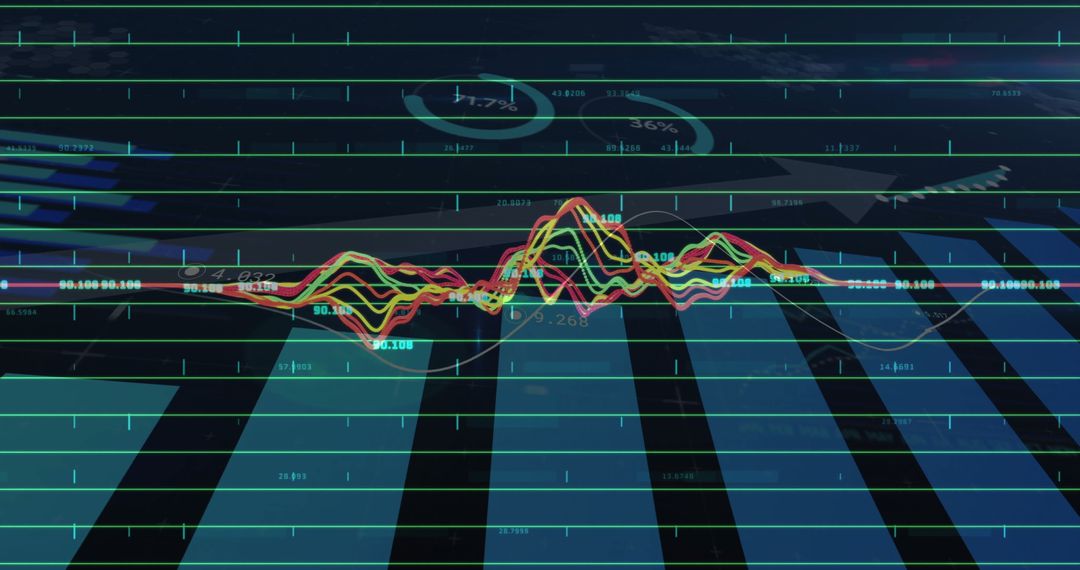
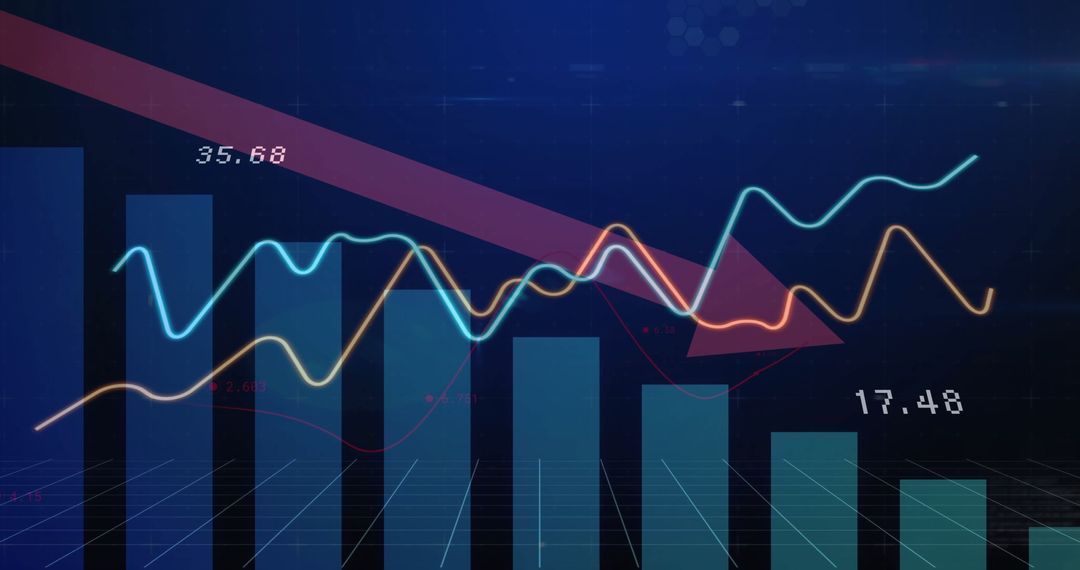
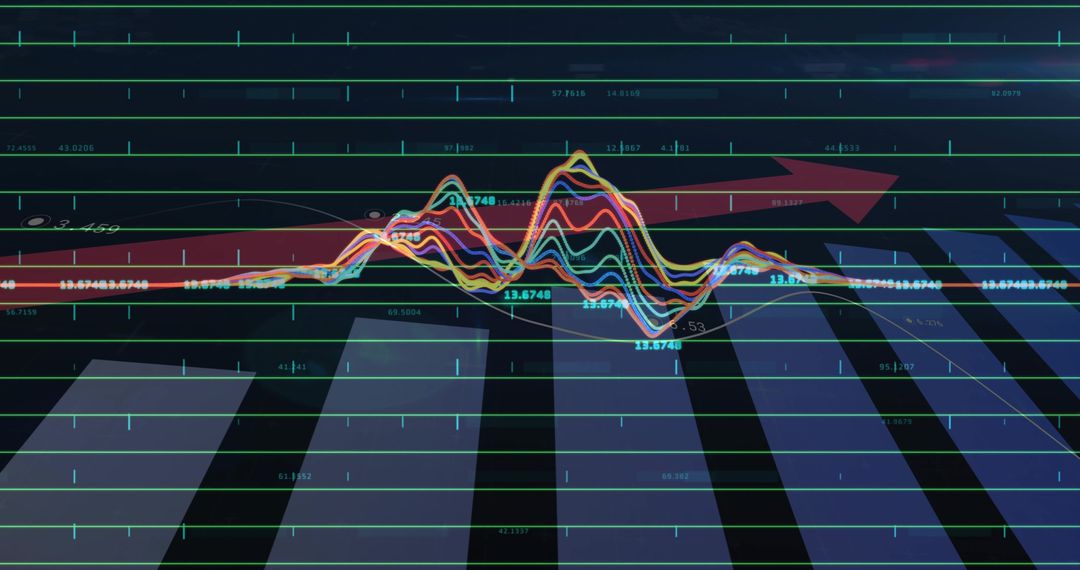
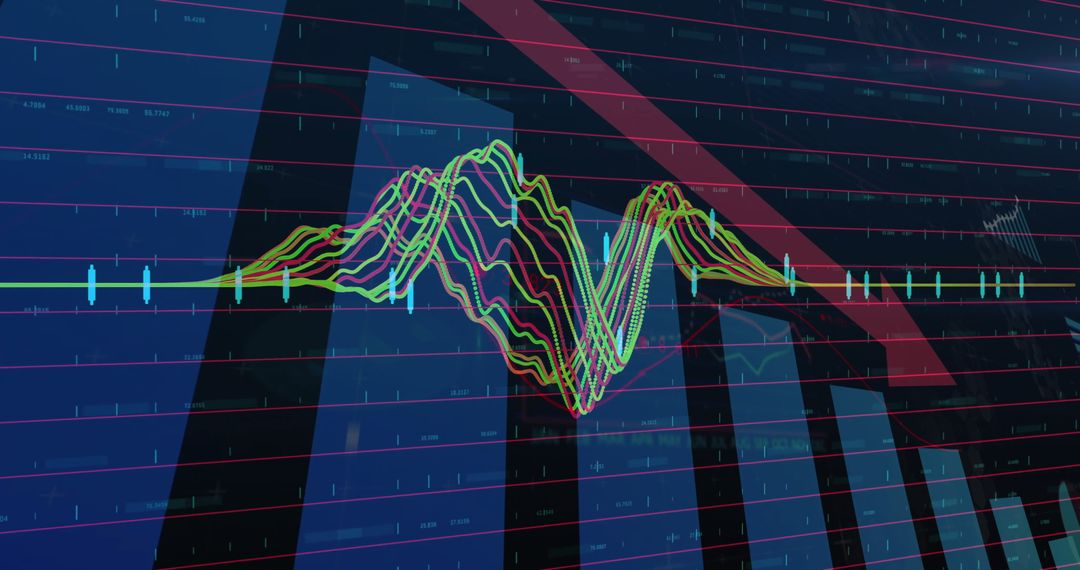
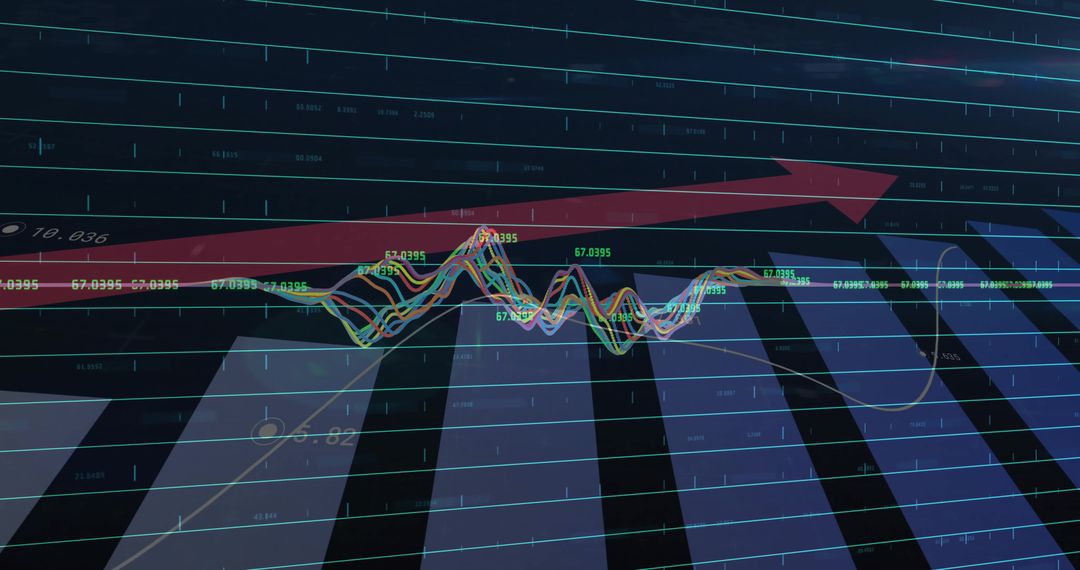
- Futuristic financial dashboard with multicolor line charts, red descending arrow and bar graphs
Futuristic financial dashboard with multicolor line charts, red descending arrow and bar graphs Image

Featuring multicolor line plots tracing fluctuating values across dark grid overlay, bold red arrow pointing downward, translucent bar graphs rising behind lines, and numeric readouts highlighting key data points. Neon blue and cyan tones combined with high-contrast accents creating futuristic, high-tech atmosphere suitable for finance and technology themes. Suggested uses: - Decorating business presentation slides illustrating market volatility, downturns, or performance analysis - Serving as header for financial blog posts, newsletters, or market reports - Acting as background for fintech app mockups, dashboards, or pitch decks - Enhancing editorial content about stock market trends, technical analysis, or economic forecasts - Supplying visual for advertising campaigns, social media posts, or corporate websites focused on trading, investment, or data analytics Usage tips: Emphasizing volatility and bearish trend messaging by overlaying concise headlines or data callouts; applying color grading or transparency adjustments for seamless integration with text and brand elements. Files with transparent overlays or color adjustments working well for layering with text, logos, or icons.
Powered by  - Get 15% off with code: PIKWIZARD15


0
downloads
downloads
Tags:
More
Credit Photo
If you would like to credit the Photo, here are some ways you can do so
Text Link
photo Link
<span class="text-link">
<span>
<a target="_blank" href=https://pikwizard.com/photo/futuristic-financial-dashboard-with-multicolor-line-charts-red-descending-arrow-and-bar-graphs/d18f844fac5330ab26b13c9135fc503d/>PikWizard</a>
</span>
</span>
<span class="image-link">
<span
style="margin: 0 0 20px 0; display: inline-block; vertical-align: middle; width: 100%;"
>
<a
target="_blank"
href="https://pikwizard.com/photo/futuristic-financial-dashboard-with-multicolor-line-charts-red-descending-arrow-and-bar-graphs/d18f844fac5330ab26b13c9135fc503d/"
style="text-decoration: none; font-size: 10px; margin: 0;"
>
<img src="https://pikwizard.com/pw/medium/d18f844fac5330ab26b13c9135fc503d.jpg" style="margin: 0; width: 100%;" alt="" />
<p style="font-size: 12px; margin: 0;">PikWizard</p>
</a>
</span>
</span>
Free (free of charge)
Free for personal and commercial use.
Author: Awesome Content
Similar Free Stock Images

Premium


Premium


Premium


Premium


Premium


Premium


Premium


Premium


Premium


Premium


Premium


Premium


Premium


Premium


Premium


Premium


Premium


Premium


Premium


Premium


Premium


Premium


Premium


Premium

