- Home >
- Stock Photos >
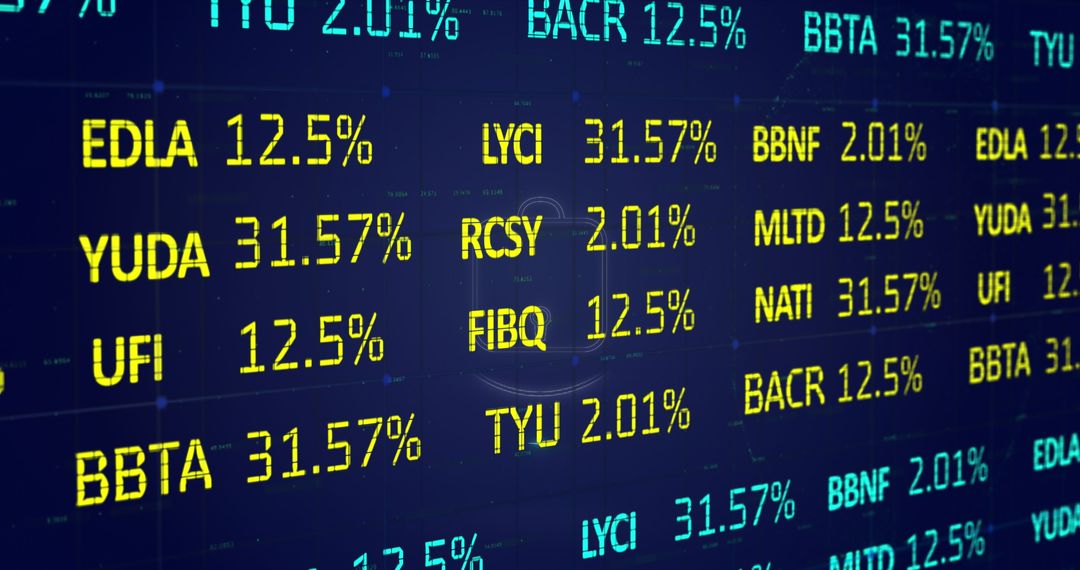
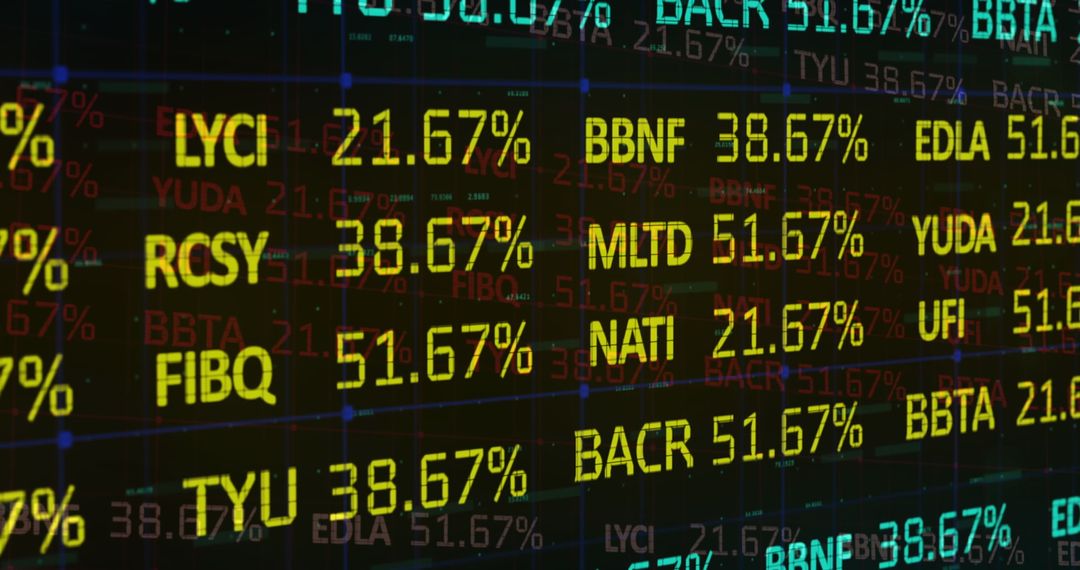
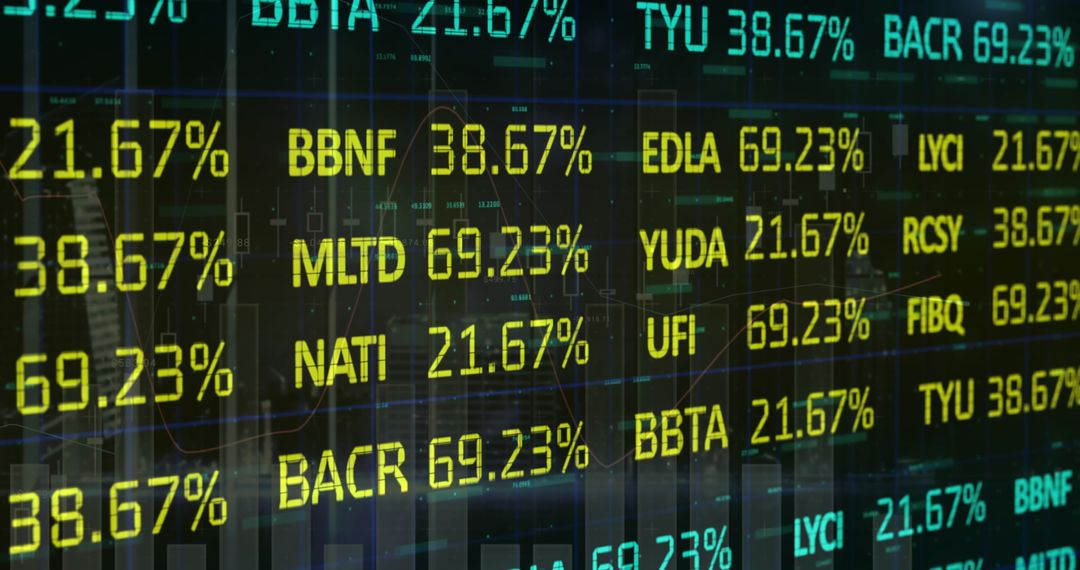
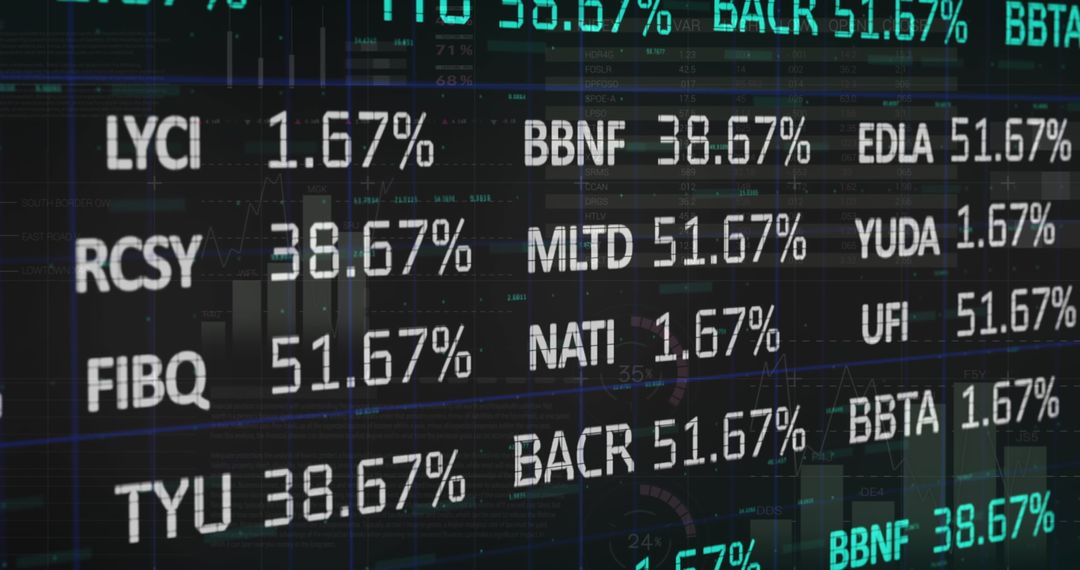
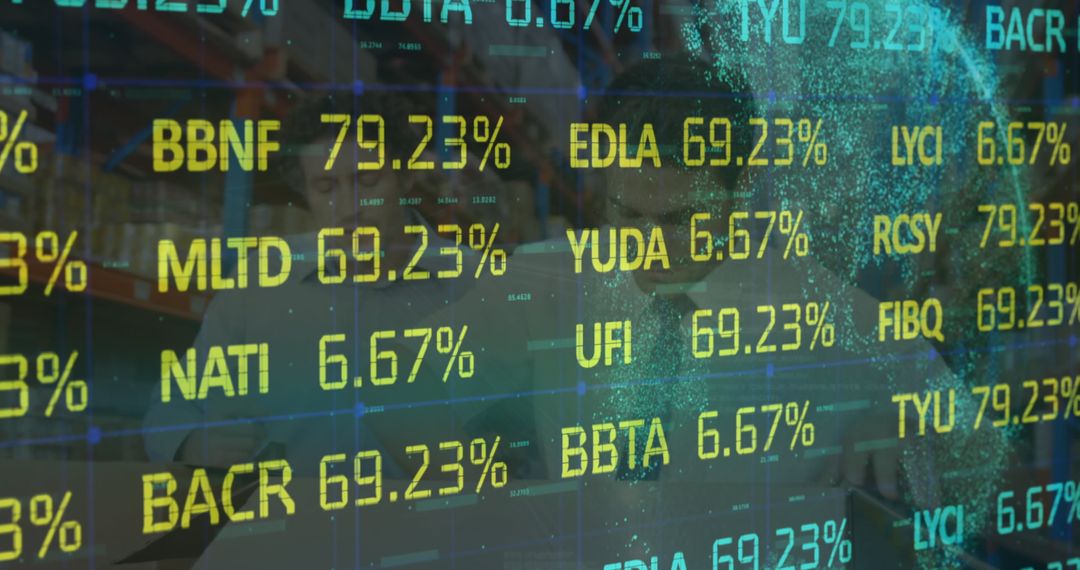
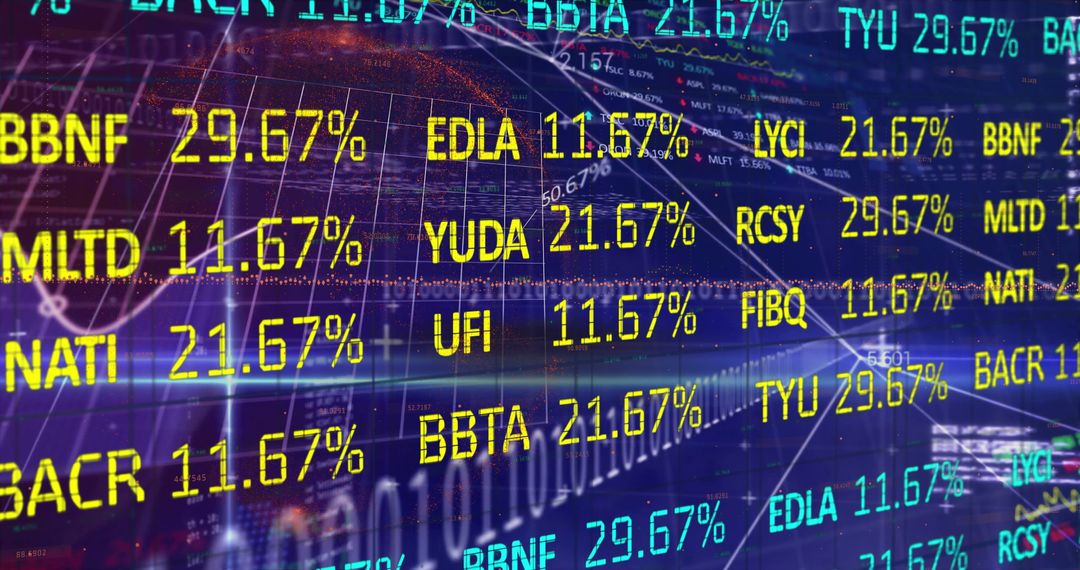
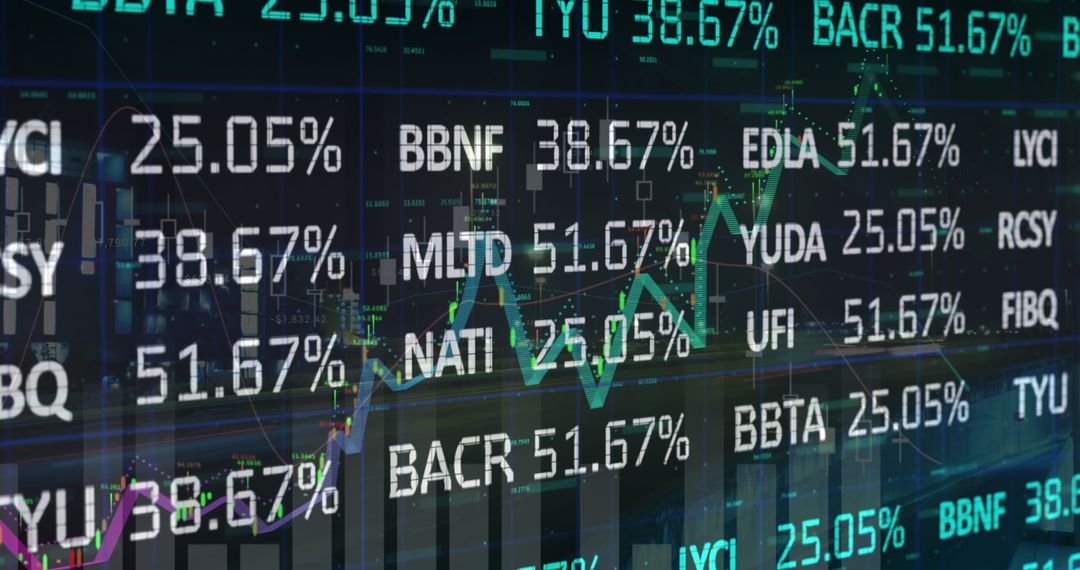
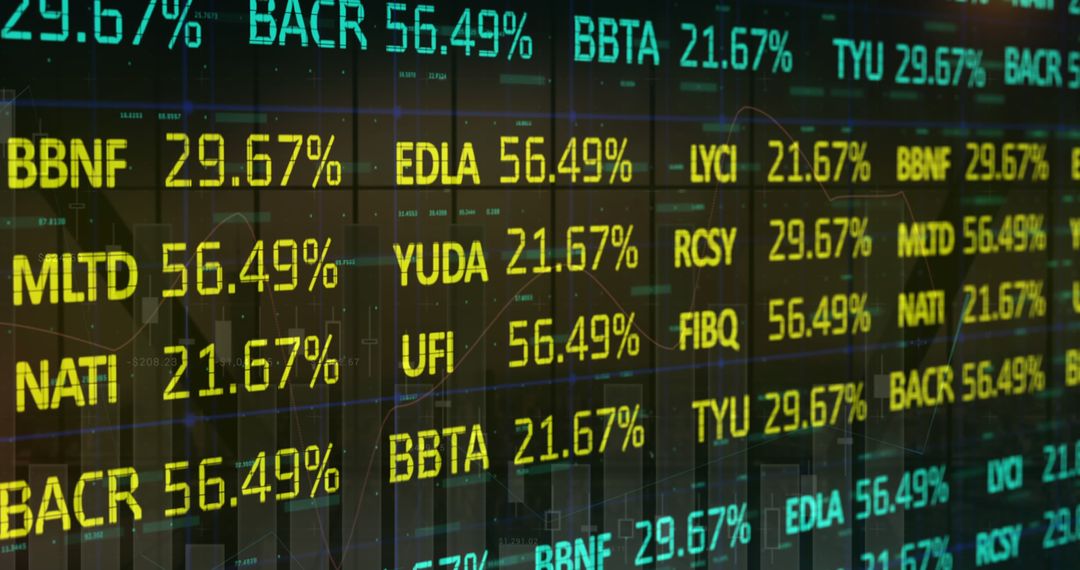
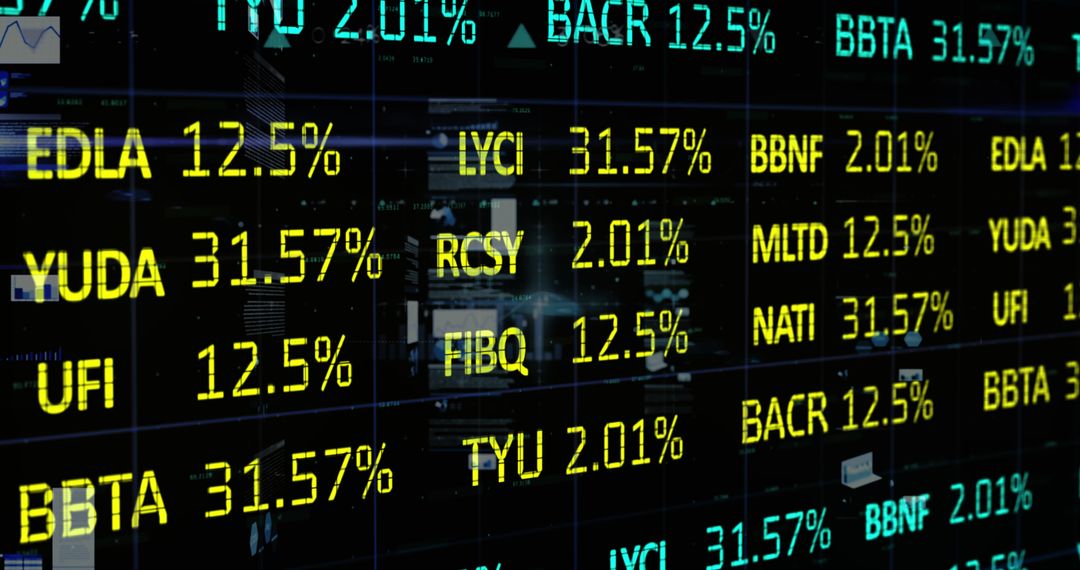
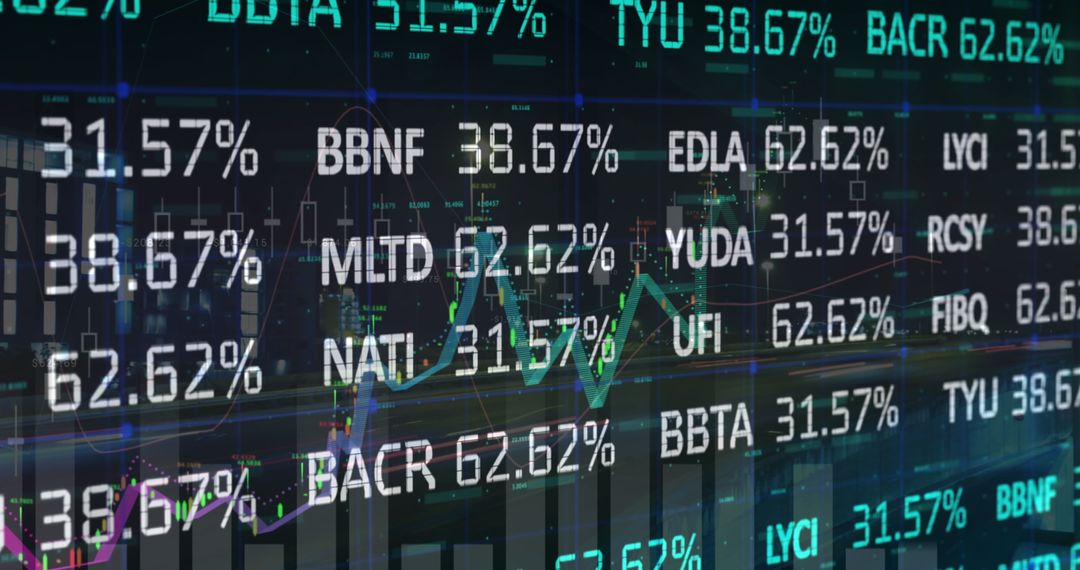
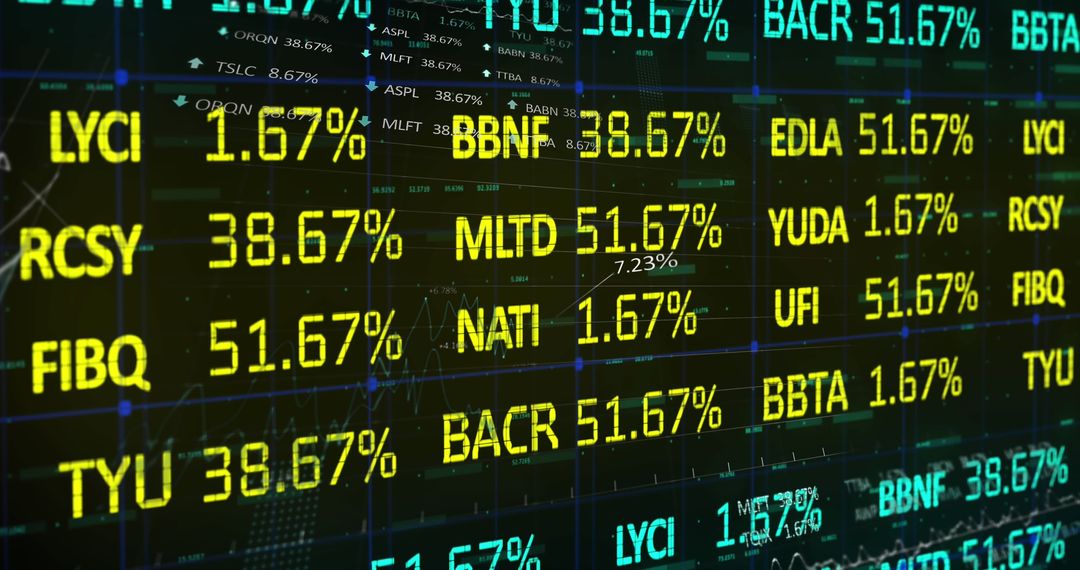
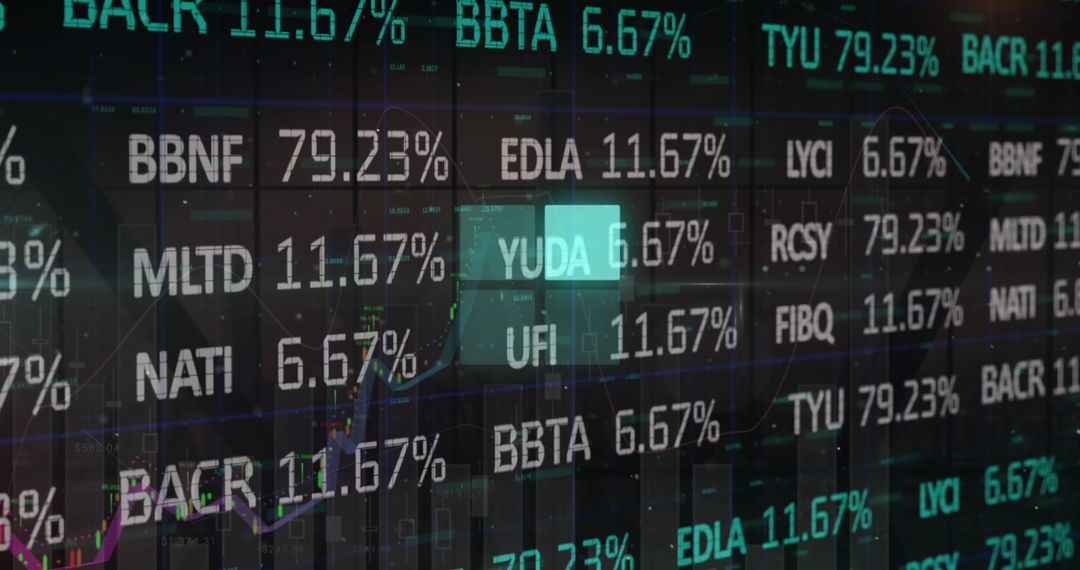
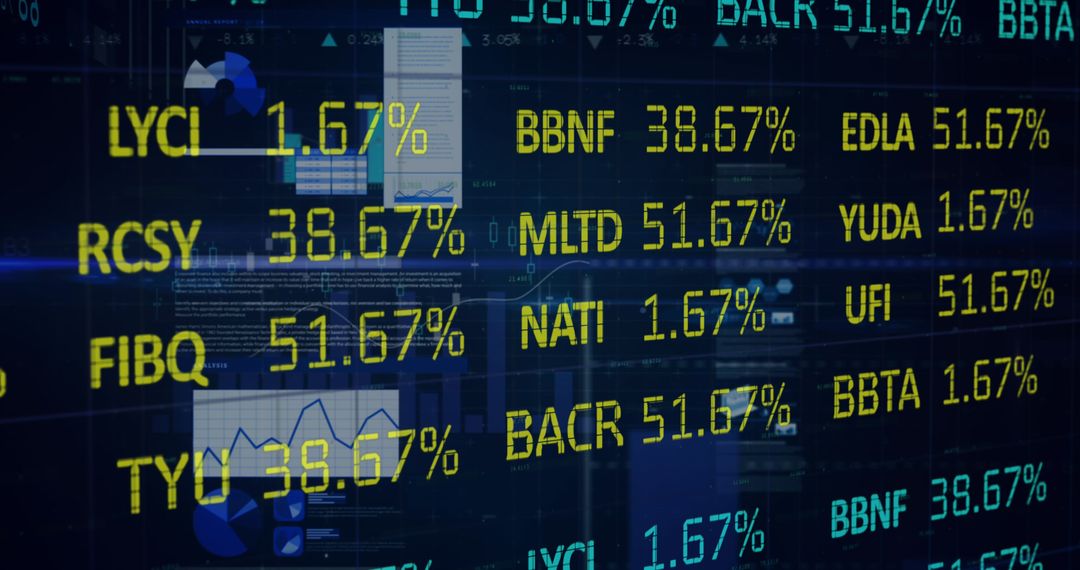
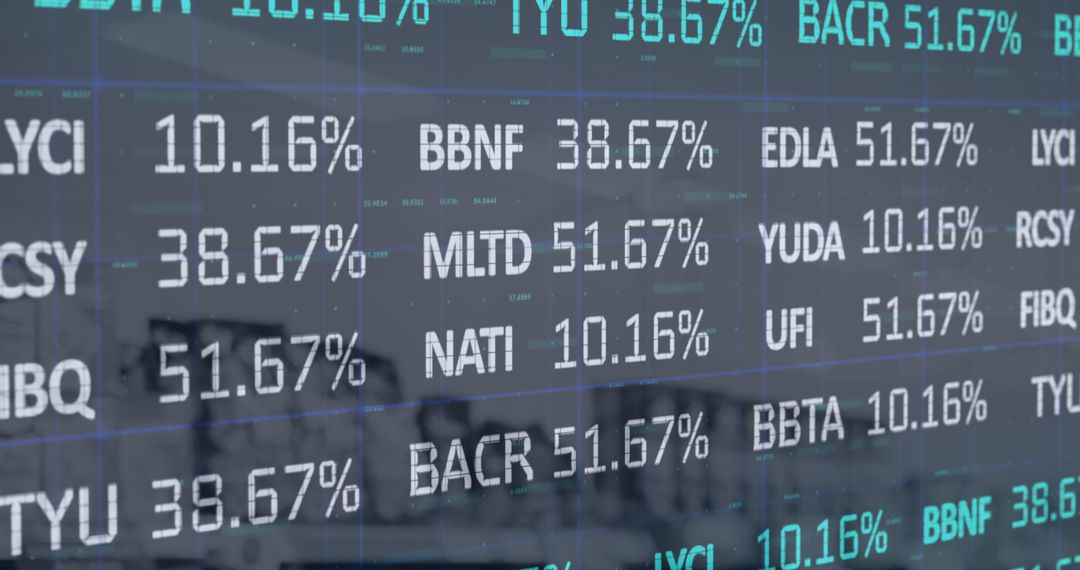
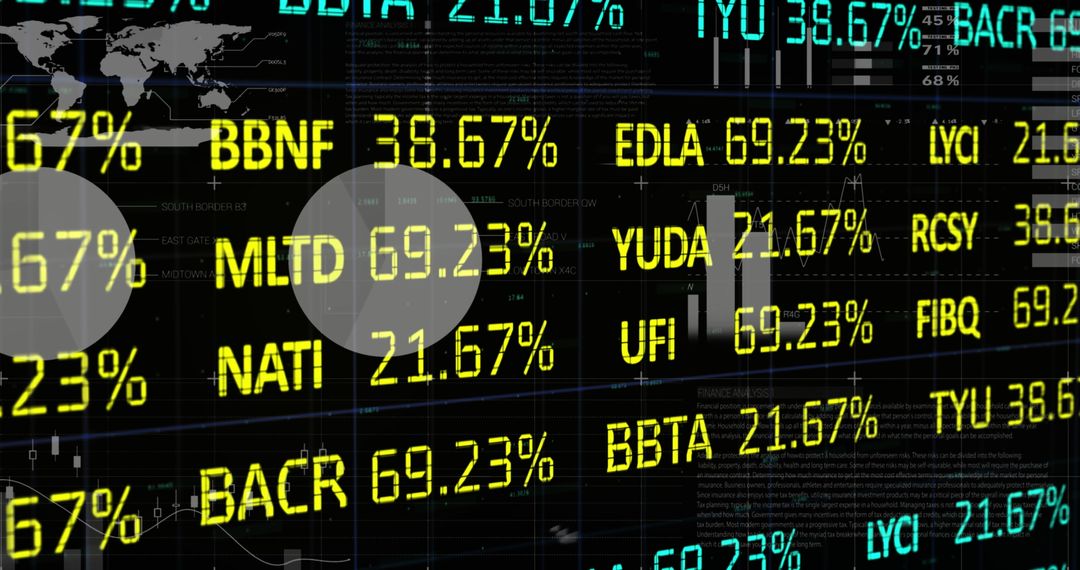
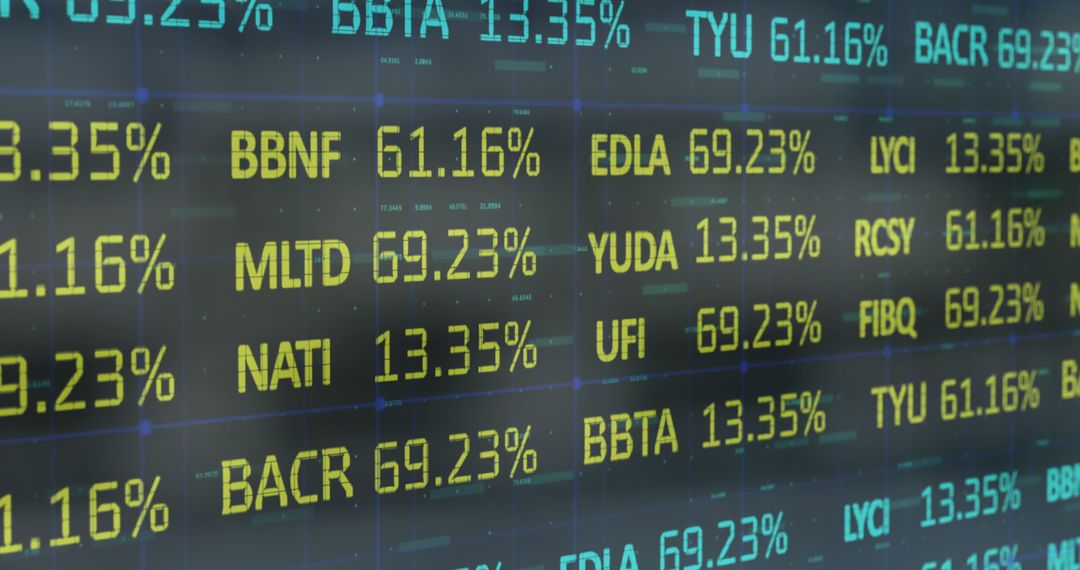
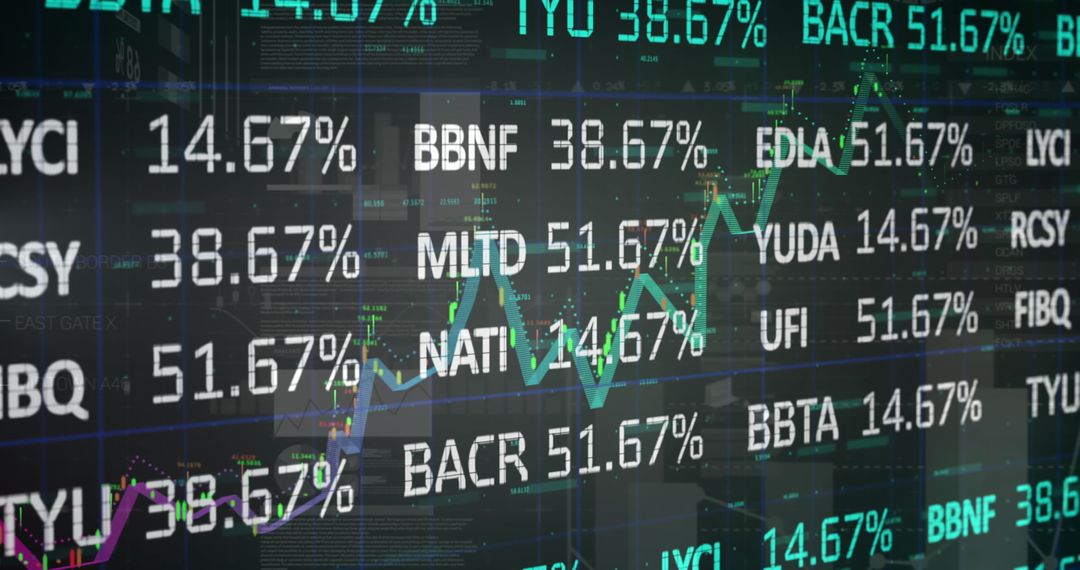
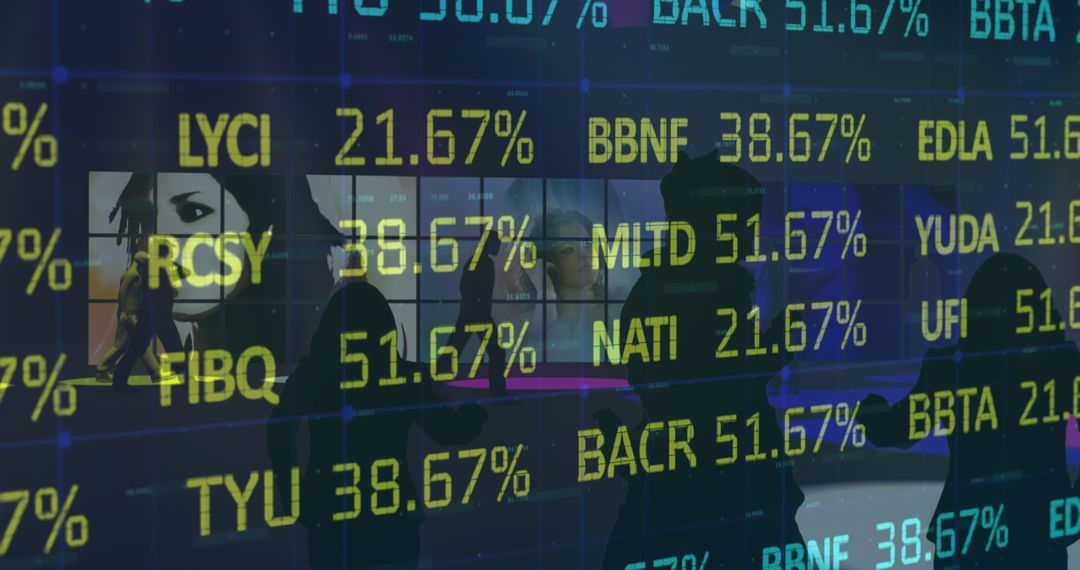
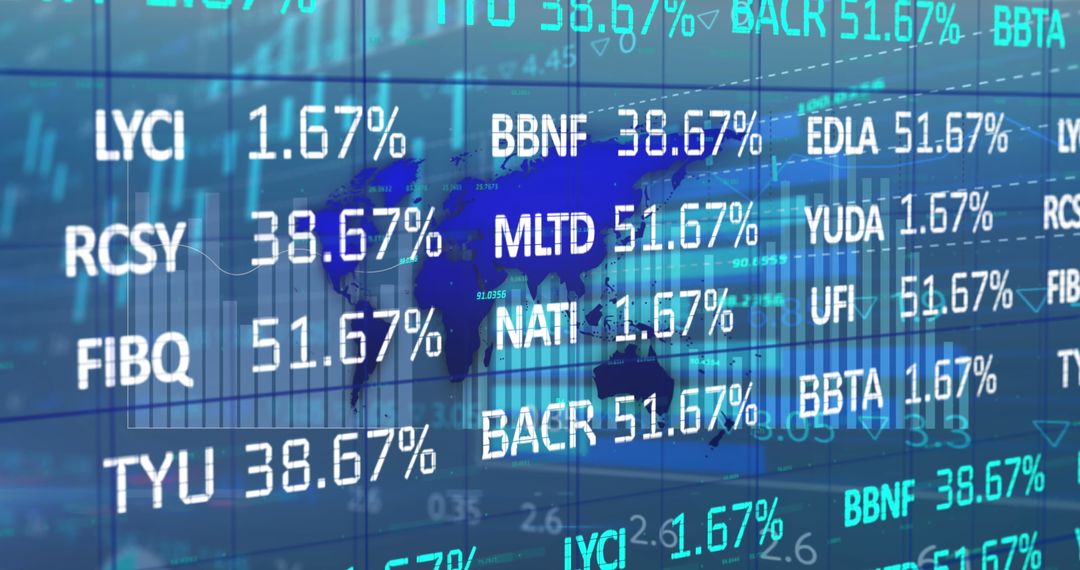
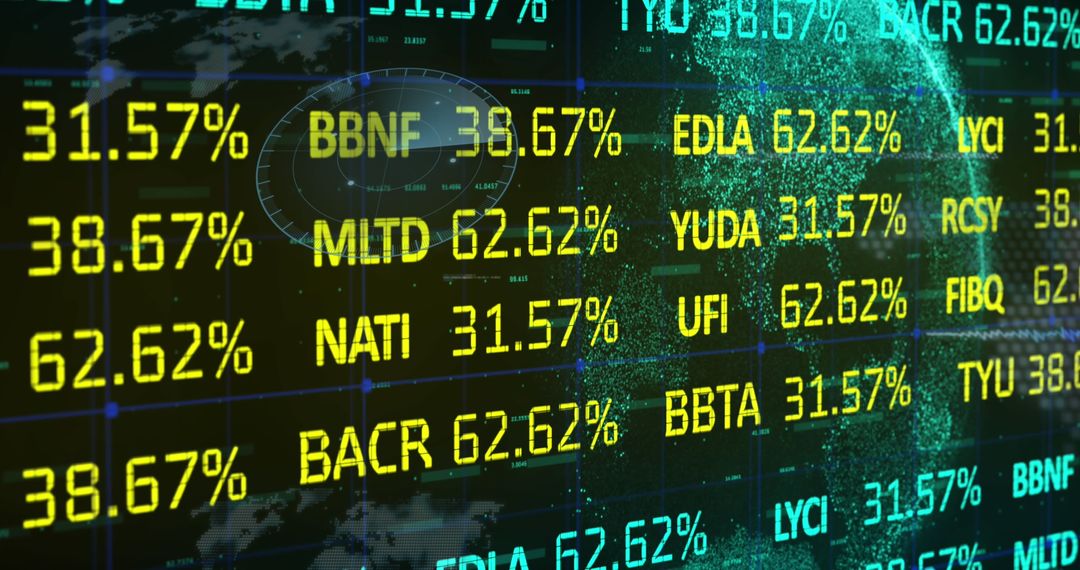
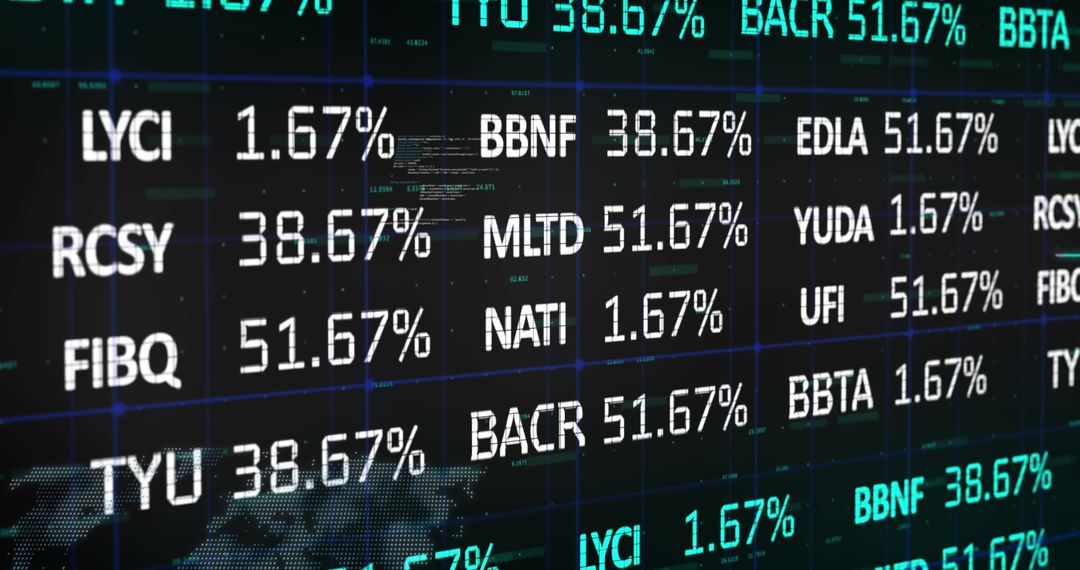
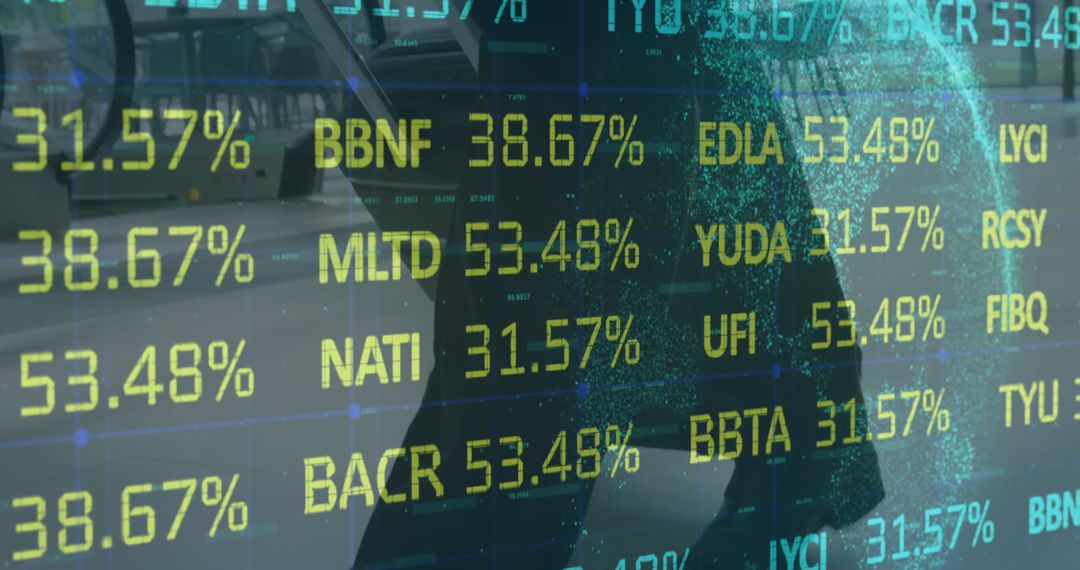
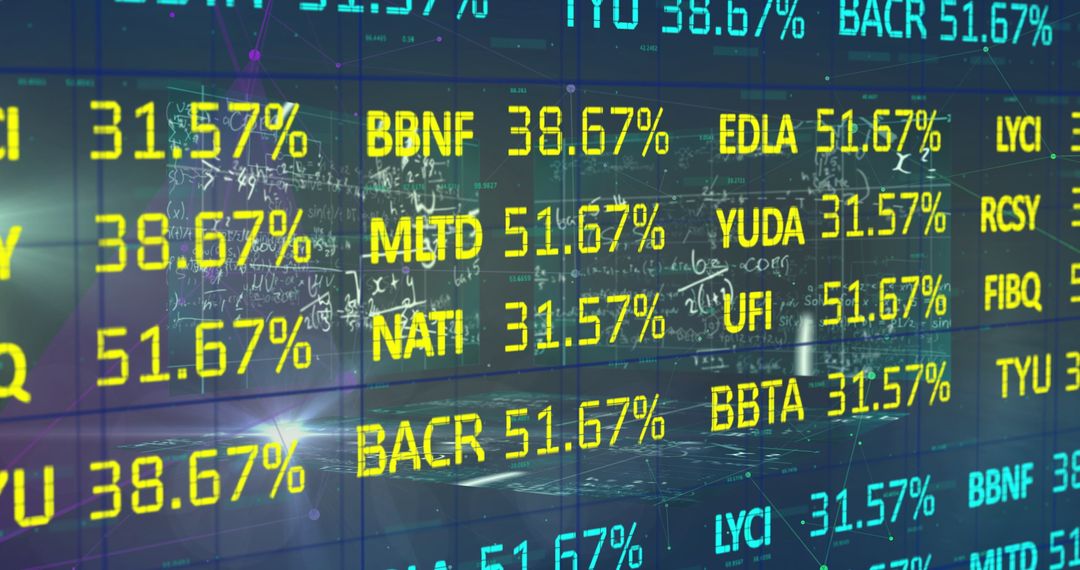
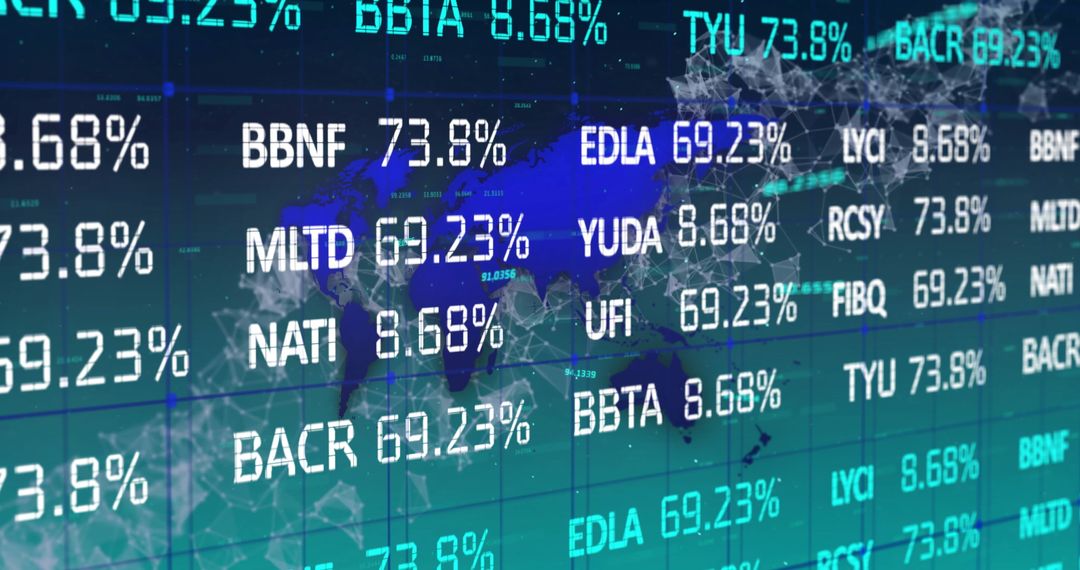
- Futuristic Financial Dashboard with Stock Market Data Visualizations
Futuristic Financial Dashboard with Stock Market Data Visualizations Image
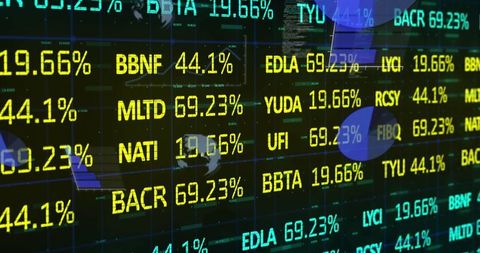
Futuristic financial dashboard presents stock market data and analytics with an innovative approach. Designed for investors and business professionals needing current data, visuals provide an overview of stock market trends with engaging visuals including tickers and percentage statistics. Ideal for presentations, technology articles, and educational resources on modern investment techniques and market analysis. Incorporates digital and global themes with pie charts and world map elements to illustrate connectivity.
Powered by  - Get 15% off with code: PIKWIZARD15


2
downloads
downloads
Tags:
More
Credit Photo
If you would like to credit the Photo, here are some ways you can do so
Text Link
photo Link
<span class="text-link">
<span>
<a target="_blank" href=https://pikwizard.com/photo/futuristic-financial-dashboard-with-stock-market-data-visualizations/4369b9d5f6c1e4305a56216691811eb8/>PikWizard</a>
</span>
</span>
<span class="image-link">
<span
style="margin: 0 0 20px 0; display: inline-block; vertical-align: middle; width: 100%;"
>
<a
target="_blank"
href="https://pikwizard.com/photo/futuristic-financial-dashboard-with-stock-market-data-visualizations/4369b9d5f6c1e4305a56216691811eb8/"
style="text-decoration: none; font-size: 10px; margin: 0;"
>
<img src="https://pikwizard.com/pw/medium/4369b9d5f6c1e4305a56216691811eb8.jpg" style="margin: 0; width: 100%;" alt="" />
<p style="font-size: 12px; margin: 0;">PikWizard</p>
</a>
</span>
</span>
Free (free of charge)
Free for personal and commercial use.
Author: Awesome Content
Similar Free Stock Images

Premium


Premium


Premium


Premium


Premium


Premium


Premium


Premium


Premium

Premium


Premium


Premium


Premium


Premium


Premium

Premium

Premium


Premium


Premium


Premium


Premium

Premium


Premium


Premium