
- Home >
- Stock Photos >
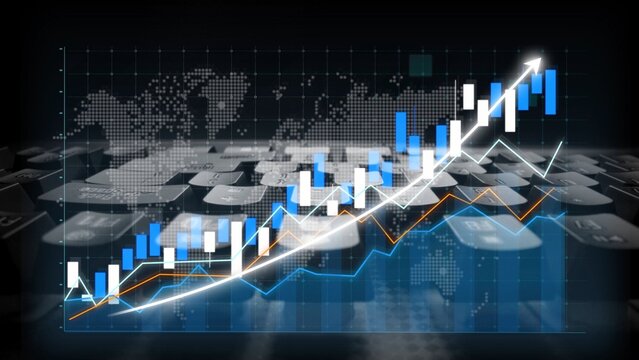
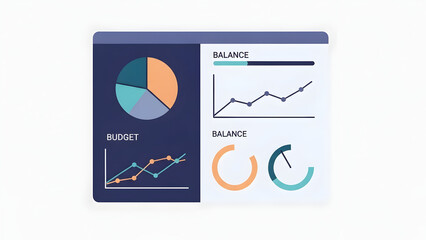
- Futuristic Financial Data Analysis in Digital Rendering
Futuristic Financial Data Analysis in Digital Rendering Image

Digital rendering showcasing futuristic representation of financial data analysis with statistical graphs and stock market information. Ideal for use in economic forecasting presentations, research publications, technology and finance reports, and business analytics marketing materials.
Powered by 


downloads
Tags:
More
Credit Photo
If you would like to credit the Photo, here are some ways you can do so
Text Link
photo Link
<span class="text-link">
<span>
<a target="_blank" href=https://pikwizard.com/photo/futuristic-financial-data-analysis-in-digital-rendering/beb3ca0079218972b659d09c879ad11b/>PikWizard</a>
</span>
</span>
<span class="image-link">
<span
style="margin: 0 0 20px 0; display: inline-block; vertical-align: middle; width: 100%;"
>
<a
target="_blank"
href="https://pikwizard.com/photo/futuristic-financial-data-analysis-in-digital-rendering/beb3ca0079218972b659d09c879ad11b/"
style="text-decoration: none; font-size: 10px; margin: 0;"
>
<img src="https://pikwizard.com/pw/medium/beb3ca0079218972b659d09c879ad11b.jpg" style="margin: 0; width: 100%;" alt="" />
<p style="font-size: 12px; margin: 0;">PikWizard</p>
</a>
</span>
</span>
Free (free of charge)
Free for personal and commercial use.
Author: People Creations
Similar Free Stock Images

Premium

Premium

Premium


Premium


Premium


Premium

Premium


Premium


Premium

Premium

Premium


Premium


Premium


Premium


Premium


Premium


Premium


Premium


Premium


Premium


Premium
Premium

Premium


Premium


Premium


Explore More Free Stock Images