1. Home > 
  2. Stock Photos > 
  3. Futuristic Financial Data Analysis Interface Concept

Futuristic Financial Data Analysis Interface Concept Image

Futuristic Financial Data Analysis Interface Concept

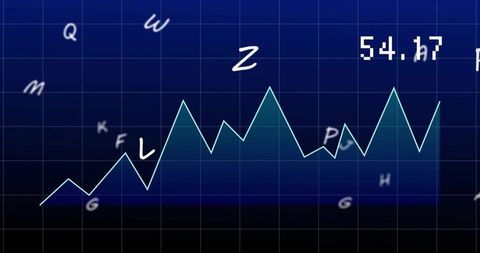
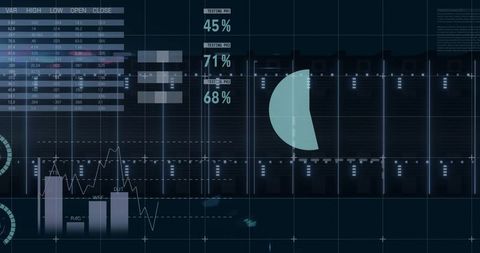
Visual depiction of a futuristic financial data interface featuring dynamic graphs, fluctuating percentages, and essential financial statistics on dark screen. Details showcase the complexity of financial market analysis involving digital data processing. Useful for illustrating themes related to global business trends, advanced computing technologies, and modern economic analysis in presentations, reports, and digital media.

Powered by Shutterstock logo - Get 15% off with code: PIKWIZARD15
Two diverse crypto traders brokers stock exchange market investors discussing trading charts research reports growth using pc computer looking at screen analyzing invest strategy, financial risks. - Powered by Shutterstock - Get 15% off with code: PIKWIZARD15Night planet earth from space with light lines of communication and connection. Business and finance, concept.  Global communications system and the World Wide Web. Technologies and communications. - Powered by Shutterstock - Get 15% off with code: PIKWIZARD15Man look at the dashboard with graphs and charts. Concept of data management system, business intelligence, data statistics, marketing analysis, key performance indicators (KPI) and analytics. - Powered by Shutterstock - Get 15% off with code: PIKWIZARD15Night planet earth from space with light lines of communication and connection. Business and finance, concept.  Global communications system and the World Wide Web. Technologies and communications. - Powered by Shutterstock - Get 15% off with code: PIKWIZARD15Stockmarket online trading chart candlestick on crypto currency platform. Stock exchange financial market price candles graph data pattern analysis concept. Computer screen closeup background - Powered by Shutterstock - Get 15% off with code: PIKWIZARD15

Credit Photo

If you would like to credit the Photo, here are some ways you can do so

Free (free of charge)

Free for personal and commercial use.

Author: Awesome Content

Similar Free Stock Images

Digital Financial Data Interface with Analytics
Premium
Business finance data analytics graph.Financial management technology.Advisor using KPI Dashboard on virtual screen.
Digital Data Transfer with Encrypted Processing Banner
Digital Data Analysis with Futuristic Charts
Digital Financial Data Display with Graphs and Analytics
Digital Interface Displaying Stock Market Data and Statistics
Premium
Young indian business man trader wearing glasses looking at computer screen with trading charts reflecting in eyeglasses watching stock trading market financial data growth concept, close up.
Digital Interface with Analytics Graphs and Pie Chart Visualization
Digital Financial Data Processing and Analysis Graphics
Graphical Display of Stock Market Trends with Gradient Background
Infographic Interface Over Cityscape: Business Growth Analysis
Premium
Stock market analysis, business, finance and investment. Finance analyst analyzing stock market trading graph, economic growth chart, planning and strategy, business investment with financial report
Abstract Graphic Business Data Visualization
Futuristic Data Visualization with Graphs and Charts
Abstract Global Network with Dynamic Graphs
Analyzing Digital Graphs Highlighting Financial Data Trends
Premium
Online trading, Investment, Strategy market plan, and Stock mark
Financial Data Analytics with Graphs and statistics
Financial Data Processing Over Digital Interface and Graphs
Digital Financial Data Analysis on Dark Background
Stock Market Analysis with Graphs and Trading Data
Premium
Image of statistical and stock market data processing against view of tall buildings. Global economy and business data technology concept
Digital Financial Data Analysis on Futuristic Blue Interface
Financial Data Processing with Charts and Graphics on Digital Blue Background
Dynamic Financial Data Charts and Digital Interface Concepts
Global Financial Data Processing with Graphs and Charts on Dark Background
Premium
Businessman pointing chart financial goals and economic business planning global.
Financial Data Charts with Network Connections Digital Interface
Modern Data Dashboard Display with Interactive Charts
Dynamic Digital Display of Financial Data
Social Media Alerts Catalysts of Financial Analytics Trends
Digital Financial Data Stream with Numeric Overlay
Digital Stock Market Trends and Financial Growth Analysis
Premium
Man look at the dashboard with graphs and charts. Concept of data management system, business intelligence, data statistics, marketing analysis, key performance indicators (KPI) and analytics.
Digital Stock Market Data and Analytics on Screen
Digital Grid Interface with Data Points for Business Analysis
Digital Financial Data Analysis with Graphs and Charts
Abstract Financial Data Interface with Graphs and Percentages
Premium
Stock market or forex trading graph on touchscreen,  finance and investment concept. Economy trends for business, financial charts and digits.
Financial Growth Graph and Data Analytics Representation
Digital Hologram with Dynamic Numbers on Graph Grid
Futuristic Data Recovery Concept on Digital Interface
Financial Data Processing with Digital Graph Overlay
Premium
Business analysis, trading concept, Businessman, finance analyst using digital tablet, analyzing financial graph, stock market report, economic graph growth chart, business and technology background
Digital Interface Showing Data Analytics with Graphs and Charts
Digital Financial Data Analytics on Dark Interface
Financial Analytics Display with Digital Graphs and Charts
Stock Market Analysis and Data Processing Graphic
Premium
Business people analyze financial data chart trading forex, Investing in stock markets, funds and digital assets, Business finance technology and investment concept, Business finance background.
Digital Stock Market Data and Trends Visualization
Digital Financial Graphs and Data Analysis Visualization
Data Processing with Abstract Graph and Digital Interface
Digital Display of Financial Data and Statistics
Premium
Businessman holding tablet with growing virtual hologram of statistics, graph and chart.Business strategy development and growing growth plan. Investment of growth on currency rate.
Financial Data Processing and Analytics on Blue Background
Digital Financial Analytics with Real-time Data Processing
Digital Stock Market Data Interface with Charts and Graphs
Digital Visualization of Global Networking with Statistical Graphs
Premium
Serious business man trader analyst looking at computer monitor, investor broker analyzing indexes, financial chart trading online investment data on cryptocurrency stock market graph on pc screen.
Analytics Dashboard with Dynamic Financial Graphs and Data
Dynamic Financial Trading Chart with Candlestick Graphs
Cybersecurity Dashboard With Data and Code Elements Display
Dynamic Digital Data Visualization with Graphs and Statistics
Digital Data Processing Dashboard in Global Connection Visualization
Digital Financial Graph with Rising Line Trend on Dark Background
Premium
Business finance and investment, Analyze economic growth charts for informed business finance decisions and financial decision-making. Stock Market report, Strategy, Data Collection, Forecasting
Stock Market Data Visualization Overlay Arena Shows Global Financial Analytics
Futuristic Financial Data Visualization
Digital Financial Data Analysis with Infographics and Charts
Rising Graphs and Interactive Financial Data Analytics Background
Premium
Statistics of business concept. Finance chart. Financial planning. Data analysis.
Abstract Financial Data Processing Interface
Futuristic Interface Highlighting Encrypted Data Transfer
Stock Market Analysis Digital Screen with Graphs and Trends
Abstract Digital Stock Market Analysis with Graphs
Premium
Earth sphere hologram with candlesticks and growing lines. Panoramic Bangkok cityscape at night. Concept of forex and investment, online trading and global market
Global Financial Data Processing with Digital Interface Elements
Dynamic Data Analytics Interface Showing Statistical Trends
Financial Data Processing Visualization on Dark Background
Data Processing Overlaid on Graphs and Code in Digital Interface
Premium
Financial business accounting and banking.Growing virtual hologram of statistics, graph and chart. Investment of growth on currency rate.Digital marketing concept.
Global Financial Data and Stock Market Trends on World Map
Digital Fintech Visualization with Graphs and Data Icons
Financial Data Analytics on Digital Interface
Digital Data Processing with Technology Interface on Blue Background
Premium
Double exposure image of coin stacks on technology financial graph background.Economy trends background for business ,financial meltdown ,Cryptocurrency digital economy.
Futuristic Data Analytics and Digital Interface Overlay
Data Analysis Charts and Graphs on Digital Interface
Financial Graph Showing Indices Trends on Blue Background
Dynamic Digital Stock Market Chart with Growing Financial Trends
Premium
Businessman analyzing a business analytics (BA) or intelligence (BI) dashboard on virtual screen showing sales and operations data statistics charts and key performance indicators (KPI)
Financial Analytics Dashboard with Growth Trends and Indicators
Jagged cyan line chart on dark analytics grid with filled area and numeric label 54.17
Digital Data and Arrows Showcasing Market Trends
Digital Interface with Data Graphs and Charts
Dynamic Financial Data Analysis with Virtual Screen
Digital Financial Market Data Analyzing on Modern Screen
Premium
Internet cyberspace data information collection analytical statistics computer storage ai artificial intelligence calculation, blue background banner copyspace.
Digital Financial Data Processing Interface on Red Background
Holographic Financial Infographic with Global Report Interface
Digital Data Analysis and Global Financial Market Indicators
Digital Interface Displaying Global Finance Data Charts
Premium
Trader analyzing data on virtual screen.Price graph and indicator. Stock market invest and crypto currency. Stock market and business investment.
Digital Finance Analytics in Modern Business Environment
Global Data Analytics and Network Visualization on Digital Grid
Dynamic Financial Graphs Illustrating Business Growth
Graph and Chart Display on White Grid Background
Premium
Stock market graph trading analysis investment financial, stock exchange financial or forex graph stock market graph chart business crisis crash loss and grow up gain and profits win up trend.
Dynamic Financial Data Charts and Graphs Background
Financial Data Charts & Analysis on Dark Screen
Digital Projection of Financial Data with Bar Graphs
Digital Display of Financial Data with Graph and Figures
Premium
The 2025 new year business goals concept. Businessman touching increase arrow graph company future growth 2025. Business plan target strategy, Planning and challenge business strategy in new year,
Digital Financial Data with Graphs and Charts on Blue Background
Futuristic Financial Data Analysis with Graphs and Charts
Digital Financial Data Display Screen with Analytics
Digital Data Processing Interface with Futuristic Visuals
Premium
Stock graph and financial chart. Analyze stock market finance volume of stock market with Graph and chart holograph technology. High quality photo
Digital Financial Data Analysis on Abstract Blue Background
Rising Sea Levels Impact Financial Trajectories Concept
Dynamic Financial Data Analytics with Stock Market Trends
Modern Multi-Line Chart on Digital Display with Candlesticks
Premium
Image of financial data processing over diverse business people in office. Global finance, business, connections, computing and data processing concept digitally generated image.
Displaying financial market trends with blue and red line charts, dotted histogram columns and perce