1. Home > 
  2. Stock Photos > 
  3. Futuristic Financial Data Analysis Interface with Abstract Graphs

Futuristic Financial Data Analysis Interface with Abstract Graphs Image

Futuristic Financial Data Analysis Interface with Abstract Graphs

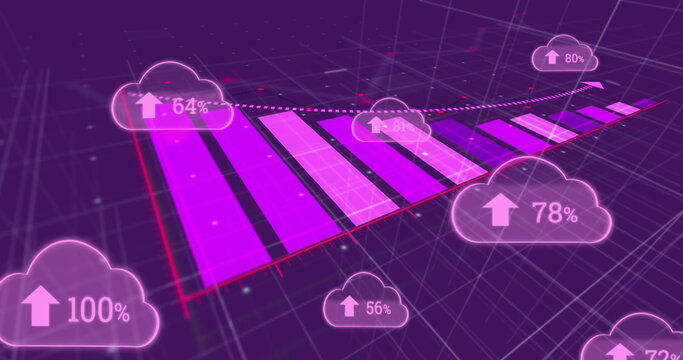
Abstract digital interface displaying financial data and statistics on a striking purple background. Bars and graphs float over a modern interface, offering advanced symbolism suited for digitally driven economics and technology contexts. Ideal for illustrating finance analytics, business presentations, fintech themes, and technology showcases, emphasizing data analysis and modern economy visuals.

Powered by Shutterstock logo - Get 15% off with code: PIKWIZARD15
Image of financial data processing over purple shapes on black background. Finances, business, computing and digital interface concept digitally generated image. - Powered by Shutterstock - Get 15% off with code: PIKWIZARD15Image of financial data processing over purple spots on black background. Finances, business, computing and digital interface concept digitally generated image. - Powered by Shutterstock - Get 15% off with code: PIKWIZARD15Image of financial data processing over purple spots on black background. Finances, business, computing and digital interface concept digitally generated image. - Powered by Shutterstock - Get 15% off with code: PIKWIZARD15Large pie chart showing purple red blue segments on dark dashboard with arrows, copy space. Data visualization, financial analytics, digital interface, corporate technology, an​​alytics dashboard, - Powered by Shutterstock - Get 15% off with code: PIKWIZARD15Image of financial data processing over purple spots on black background. Finances, business, computing and digital interface concept digitally generated image. - Powered by Shutterstock - Get 15% off with code: PIKWIZARD15

Credit Photo

If you would like to credit the Photo, here are some ways you can do so

Free (free of charge)

Free for personal and commercial use.

Author: Creative Art

Similar Free Stock Images

Abstract Data Visualization on Purple Background
Premium
Image of financial data processing over purple spots on black background. Finances, business, computing and digital interface concept digitally generated image.
Digital Financial Graphs and Data Overlay on Hazy Background
Premium
Floating data overlays over circuit board, with numeric data, chart bars, world map and lens flare. Technology, finance, analytics, digital, innovation, data-driven, futuristic
Premium
Image of financial data processing over purple spots on black background. Finances, business, computing and digital interface concept digitally generated image.
Financial Data Overlay on Cityscape Conceptual Image
Futuristic Digital Network Sphere with Data Analytics Visualization
Futuristic Cityscape with Data Graphs and Growth Concepts
Abstract Global Data Processing Concept with Digital Overlay
Abstract Financial Data Analysis with Graphs and Equations
Financial and Chemical Structural Analysis Overlaid on Digital Interface
Dynamic Financial Data Visualization with Moving Numbers
Financial Data Signals Overlaid on Online Data Security Center
Premium
Digital composite of model + various backgrounds  + interface graphics
Premium
Innovative technology background. Mixed media
Futuristic Financial Data Visualization with Candlesticks
Digital Data Lines with Mathematical Equations on Blue Background
Dynamic Green Data and Statistics Visualization over Digital Interface
Digital Data Analysis Abstract Background with Graphs
Dynamic Data Processing Concept in Futuristic City Skyline
Neon sustainability finance dashboard showing CO2 EV euro metrics with candlestick charts
Digital Interface Grid Over Urban Skyline Illustrating Futuristic Technology
Financial Data and Graphs on Digital Blue Background
Premium
Multi exposure of virtual abstract financial graph interface on modern interior background, financial and trading concept
City Horizons Blending with Digital Data Analytics Visualization
Data Processing Visualization with Digital Charts on Blue Background
Purple World Map on Dark Green Data Screen with Chalk Formulas
Financial Data Analysis with Digital Patterns
Premium
Displaying purple 3D bar chart cluster on left of dashboard, with floating line charts, copy space. Futuristic, data, visualization, interface, digital, analytics, technology
Digital Financial Data Dashboard with Bar and Line Graphs
Abstract Digital Interface Analyzing Global Financial Data
Financial Growth Trends with Digital Overlay in City
Digital Network Overlay with Virtual Call Connections
Financial Graphs and Cityscape for Digital Business Concept
Abstract Financial Data and Charts in Urban City Background
Futuristic Graphs and Data on Blue Digital Interface
High-Tech Server Room with Data Analytics Overlay
Premium
Showing green candlestick chart purple line graph in data UI, numeric grid labels, network sphere. Data analysis, visualization, digital interface, financial technology, scientific research,
Premium
Displaying financial dashboard on teal cloud backdrop, with candlestick bars and dotted trend lines. Data visualization, finance, analytics, digital, technology, interface, charting
Premium
Image of financial data processing and credit card over purple circles on black background. Finances, business, computing and digital interface concept digitally generated image.
Premium
Displaying candlestick chart bars and purple dotted trend arrow on data interface, with world map. Finance, data visualization, digital interface, analytics, technology, innovation, business
Digital Financial Graphs and Data Visualization on Red Background
Abstract Financial Chart Representing Market Data Trends
Digital Data Processing with Global Connections Overlay
Cityscape Skyline with Overlay of Digital Data Patterns
City Skyline with Financial Chart and Candlesticks at Night
Financial Growth Graph Over Urban Skyline with Currencies
Abstract Stock Market and Data Analysis in Purple Hue
Premium
Displaying centered FIREWALL label on virtual cybersecurity dashboard with charts and ticker tables. Cybersecurity, data visualization, digital interface, high-tech, analytics, protection, network
Abstract Mathematical Formula Background
Illuminated Pound Currency Symbol with Data Visualization Background
Abstract Financial Graph with Trend Line and X Markers
Data Processing with Financial Graphs and Analytics
Premium
Displaying large pie chart at lower left on dashboard, with glowing globe and waveform, copy space. Data visualization, analytics, technology, digital interface, futuristic, business intelligence,
Global Financial Analysis with Digital Interface Technology Overlay
Abstract Financial Data Visualization with Floating Numbers
Abstract Data and Financial Graphs Over City Background
Digitally Generated Financial Graphs Overlaid on Cityscape
Futuristic Business Analytics and Mathematical Models
Abstract Financial Data Charts on Black Background
Digital Financial Data Overlay on Cityscape Horizon
Digital Data Visualization on Blue Background for Analytical Insights
Modern Digital Financial Chart Interface with Fluctuating Graphs
Abstract Financial Market Analysis with Candlestick and Bar Charts
Financial Analytics with Chart and Graph Overlay on Digital Background
Premium
Image of financial data processing and credit card over purple circles on black background. Finances, business, computing and digital interface concept digitally generated image.
Digital Analytics Dashboard with Data Visualization Trends
Digital Security Icons Overlaid on Abstract Stock Chart Background
Digital Graph Overlay on Night Cityscape Showing Data Analytics
Digital Icons Overlaying Modern Office for Data Processing Concept
Abstract Financial Data Chart Over Cityscape
Abstract Bar Graph Depicting Financial Service Innovations and Technology
Digital Finance Connectivity with Credit Card on Data Background
Mathematical Formulae on Gradient Background for Learning
DNA Strand Surrounded by Abstract Data Interfaces on Purple Background
Purple Graphic Representation of Data Processing and Analysis
Digital Financial Chart Over Cityscape Backdrop
Digital Financial Chart Showing Market Trends with Candlestick Bars
Abstract Financial Graph and Data Analysis Background
Premium
Double exposure of forex graph drawing over desktop background with computer. Concept of financial analysis. Top view.
Financial Data and Analysis in Futuristic Digital Interface
Premium
Sales analysis and report
Premium
Charts of financial instruments with various type of indicators including volume analysis for professional technical analysis on the monitor of a computer. Fundamental and technical analysis concept.
Financial Analysis of Market Trends in Technology Sector
Digital Financial Data Interface with Bar and Line Charts
Abstract Digital Helix with Molecular and Code Elements on Green Background
Digital Data Network with Graphs and Media Icons
Premium
Displaying dashboard visualizing data metrics on dark screen, with world map overlay and pie charts. Data visualization, analytics, dashboard, infographics, technology, information, digital interface
Blending Digital Data Visualizations with Modern Cityscape
Abstract Network Concept with Icons on Dark Background
Abstract Digital Financial Data and Oscillations
Financial Data Analysis with Graphs in Futuristic Overlay
Premium
screen of financial activities on the monitor of a computer
Premium
Double exposure of man's hands holding and using a phone and financial chart drawing. Market analysis concept.
Global Financial Trends on World Map with Digital Interface
Digital Business Growth Concepts with Financial Bar Graphs
Digital Financial Data and Icons on Green Background
Digital Financial Data Integration with Virtual Analysis Tools
Financial Data Visualization with Mathematical Formulas on Abstract Background
Abstract Technology Background with Financial Graphs and Charts
Fintech Visualization With Digital Number Interface
Digital Data Processing and Cybersecurity Visualization
Candlestick Chart Overlay in Dimly Lit Server Room
Abstract Financial Data with Global Business Interface Concept
Digital Cityscape and Data Overlay with Futuristic Interface
Premium
Showing overlapping trend lines and candlestick bars on trading display, with % labels, HUD overlay. Financial, analytics, digital, technology, data, visualization, investment
Premium
Image of statistical data processing against close up view of a pen and diary on office table. Computer interface and business data technology concept
Financial Data Over Cityscape with Glowing Graph Lines
Digital Thumbs-Up in Data-Driven Futuristic Cityscape
Abstract Digital Financial Market Analysis Concept
Digital Financial Data and Analytics Background
Modern Finance Analytics with Digital Charts and Data
Abstract Financial Data Graph with Stock Market Trends
Digital Visualization of Financial and Statistical Data
Digital Financial Dashboard with Candlestick Charts and Trend Analysis
Premium
Displaying chart on office desktop with smartphone, calculator keypad and candlestick data overlays. Financial analysis, data visualization, digital interface, investment, analytics, business
Abstract Digital Interface with Data and Graphs in Blue Hue
Digital Financial Data Chart with Dynamic Analytics Graphs
Digital Data Processing with Graphs Overlaid on Green Servers
Abstract Digital Financial Data Charts on Gradient Background
Premium
Multi exposure of business theme icons and work space with computer background. Concept of success.
Premium
Financial market graph and top view computer on the desktop background. Multi exposure. Investment concept.
Digital Financial Analytics with Statistics and Data Visualization
Digital Network Overlay amid Urban Technology Infrastructure
Futuristic Financial Data Analysis Interface with Graphs
Explore More Free Stock Images