- Home >
- Stock Photos >
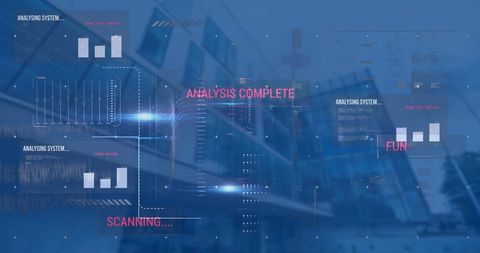
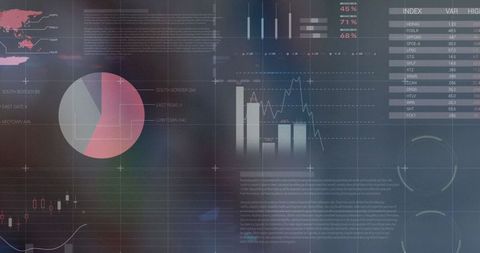
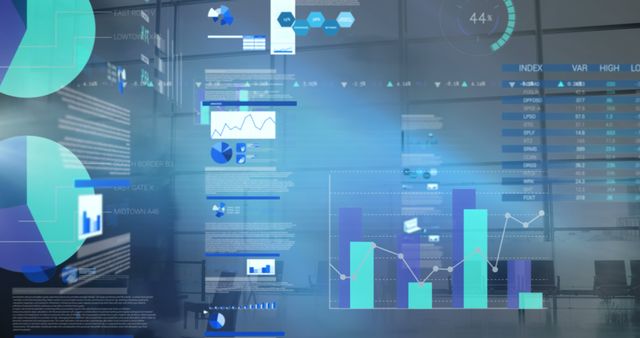
- Futuristic Financial Data Analysis Interface with Graphs and Charts
Futuristic Financial Data Analysis Interface with Graphs and Charts Image
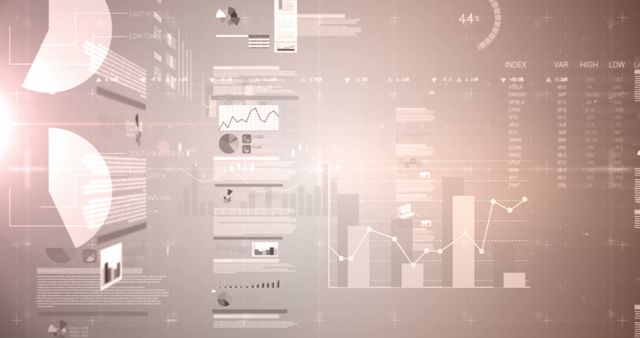
This representation of digital financial analytics interface, showcasing graphs and charts, is ideal for illustrating concepts related to the stock market, business analysis, or financial management. Businesses and educators can utilize it to enhance presentations that offer financial insights, market trends, and economic forecasts. The ample copy space allows for additional textual information or branding to be easily integrated.

downloads
Tags:
More
Credit Photo
If you would like to credit the Photo, here are some ways you can do so
Text Link
photo Link
<span class="text-link">
<span>
<a target="_blank" href=https://pikwizard.com/photo/futuristic-financial-data-analysis-interface-with-graphs-and-charts/49dbe964fb408777988da9b25271beb0/>PikWizard</a>
</span>
</span>
<span class="image-link">
<span
style="margin: 0 0 20px 0; display: inline-block; vertical-align: middle; width: 100%;"
>
<a
target="_blank"
href="https://pikwizard.com/photo/futuristic-financial-data-analysis-interface-with-graphs-and-charts/49dbe964fb408777988da9b25271beb0/"
style="text-decoration: none; font-size: 10px; margin: 0;"
>
<img src="https://pikwizard.com/pw/medium/49dbe964fb408777988da9b25271beb0.jpg" style="margin: 0; width: 100%;" alt="" />
<p style="font-size: 12px; margin: 0;">PikWizard</p>
</a>
</span>
</span>
Free (free of charge)
Free for personal and commercial use.
Author: Awesome Content