
- Home >
- Stock Photos >
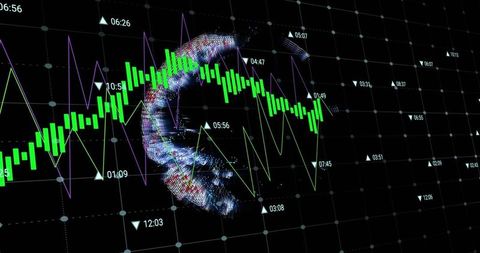
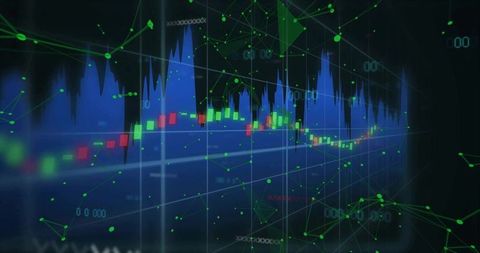
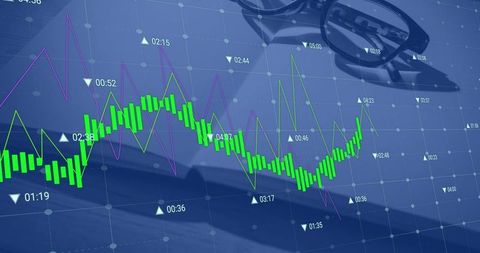
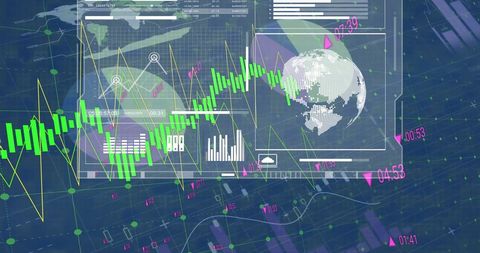
- Futuristic Financial Data Analysis with Candlestick Visualization
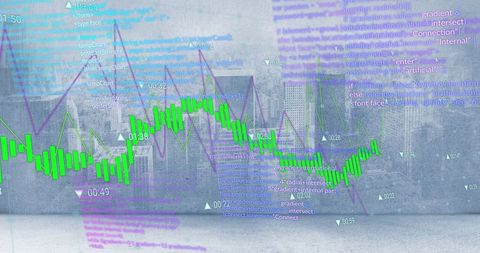
Futuristic Financial Data Analysis with Candlestick Visualization Image

This digital visualization depicts a complex and futuristic interface used for data analysis and financial technology. Featuring a mix of green candlestick charts, purple line graphs, and numerical grid labels, it reflects a modern approach to addressing financial trends and scientific research. The central network sphere conveys interconnected data networks, emblematic of today's digital innovation. Suitable for illustrating articles or presentations on digital finance, analytics solutions, or predictive modeling strategies.
Powered by 


downloads
Tags:
More
Credit Photo
If you would like to credit the Photo, here are some ways you can do so
Text Link
photo Link
<span class="text-link">
<span>
<a target="_blank" href=https://pikwizard.com/photo/futuristic-financial-data-analysis-with-candlestick-visualization/37b6b5d3d0d06564a73514da8f7b28eb/>PikWizard</a>
</span>
</span>
<span class="image-link">
<span
style="margin: 0 0 20px 0; display: inline-block; vertical-align: middle; width: 100%;"
>
<a
target="_blank"
href="https://pikwizard.com/photo/futuristic-financial-data-analysis-with-candlestick-visualization/37b6b5d3d0d06564a73514da8f7b28eb/"
style="text-decoration: none; font-size: 10px; margin: 0;"
>
<img src="https://pikwizard.com/pw/medium/37b6b5d3d0d06564a73514da8f7b28eb.jpg" style="margin: 0; width: 100%;" alt="" />
<p style="font-size: 12px; margin: 0;">PikWizard</p>
</a>
</span>
</span>
Free (free of charge)
Free for personal and commercial use.
Author: Creative Art
Similar Free Stock Images

Premium

Premium


Premium


Premium

Premium


Premium

Premium
Premium


Premium


Premium


Premium


Premium


Premium


Premium


Premium


Premium

Premium


Premium


Premium


Premium


Premium


Premium
Premium

Premium

Premium


Explore More Free Stock Images