- Home >
- Stock Photos >
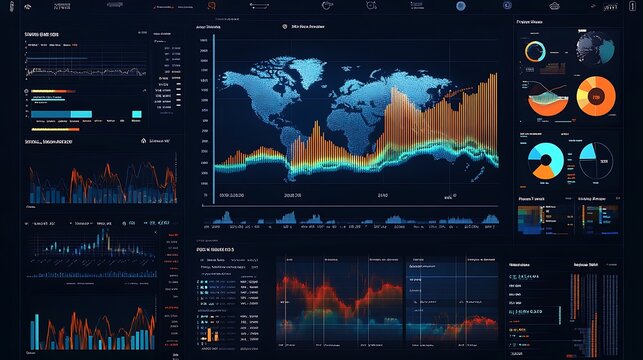
- Futuristic Financial Data Analysis with Graphs and Charts
Futuristic Financial Data Analysis with Graphs and Charts Image

Sophisticated and high-tech financial data presentation with animated charts and graphs on a blue digital display. Stock market trends and economic indicators visualized with precision, reflecting modern finance and investment analytics. Ideal for use in business presentations, stock market reports, financial technology introductions, or background visuals for financial news segments.
Powered by 


2
downloads
downloads
Tags:
More
Credit Photo
If you would like to credit the Photo, here are some ways you can do so
Text Link
photo Link
<span class="text-link">
<span>
<a target="_blank" href=https://pikwizard.com/photo/futuristic-financial-data-analysis-with-graphs-and-charts/d1b3c7c73b9ba4998f06192acf20cea9/>PikWizard</a>
</span>
</span>
<span class="image-link">
<span
style="margin: 0 0 20px 0; display: inline-block; vertical-align: middle; width: 100%;"
>
<a
target="_blank"
href="https://pikwizard.com/photo/futuristic-financial-data-analysis-with-graphs-and-charts/d1b3c7c73b9ba4998f06192acf20cea9/"
style="text-decoration: none; font-size: 10px; margin: 0;"
>
<img src="https://pikwizard.com/pw/medium/d1b3c7c73b9ba4998f06192acf20cea9.jpg" style="margin: 0; width: 100%;" alt="" />
<p style="font-size: 12px; margin: 0;">PikWizard</p>
</a>
</span>
</span>
Free (free of charge)
Free for personal and commercial use.
Author: People Creations
Similar Free Stock Images

Premium


Premium


Premium


Premium


Premium


Premium


Premium


Premium


Premium


Premium


Premium


Premium


Premium


Premium


Premium


Premium


Premium


Premium


Premium


Premium


Premium


Premium


Premium


Premium