
- Home >
- Stock Photos >
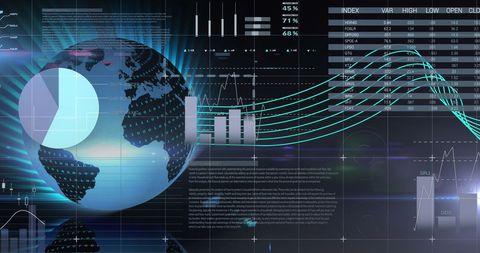
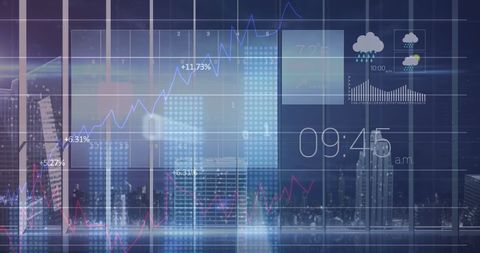
- Futuristic Financial Data Analytics on Dark Background
Futuristic Financial Data Analytics on Dark Background Image
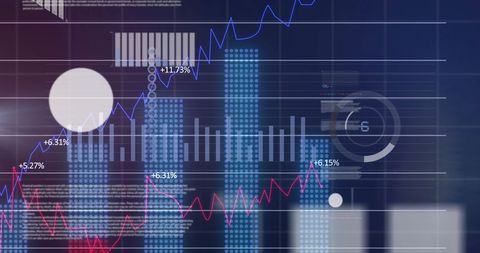
This image depicts a digital representation of financial data and analytics, featuring charts and graphs overlaid on a dark background, conveying a sense of innovation and technology. Suitable for use in contexts such as finance and business articles, presentations on data processing, and features related to global market analysis and economic trends.
Powered by 


downloads
Tags:
More
Credit Photo
If you would like to credit the Photo, here are some ways you can do so
Text Link
photo Link
<span class="text-link">
<span>
<a target="_blank" href=https://pikwizard.com/photo/futuristic-financial-data-analytics-on-dark-background/f48885331b10080c0e4415e6d30d2c78/>PikWizard</a>
</span>
</span>
<span class="image-link">
<span
style="margin: 0 0 20px 0; display: inline-block; vertical-align: middle; width: 100%;"
>
<a
target="_blank"
href="https://pikwizard.com/photo/futuristic-financial-data-analytics-on-dark-background/f48885331b10080c0e4415e6d30d2c78/"
style="text-decoration: none; font-size: 10px; margin: 0;"
>
<img src="https://pikwizard.com/pw/medium/f48885331b10080c0e4415e6d30d2c78.jpg" style="margin: 0; width: 100%;" alt="" />
<p style="font-size: 12px; margin: 0;">PikWizard</p>
</a>
</span>
</span>
Free (free of charge)
Free for personal and commercial use.
Author: Authentic Images
Similar Free Stock Images

Premium


Premium


Premium

Premium

Premium


Premium


Premium


Premium


Premium


Premium


Premium


Premium


Premium

Premium


Premium


Premium


Premium

Premium


Premium


Premium

Premium


Premium


Premium


Premium


Premium


Explore More Free Stock Images