
- Home >
- Stock Photos >
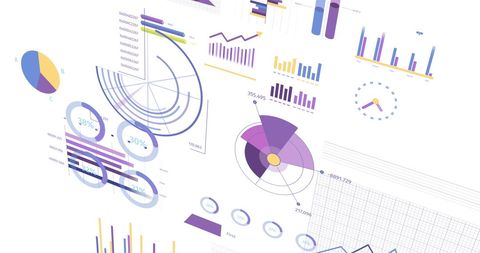
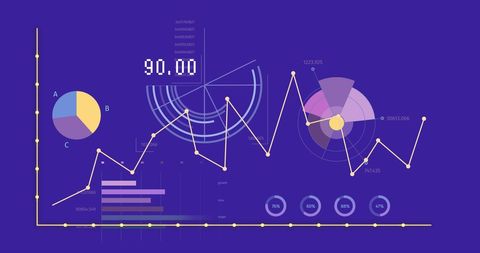
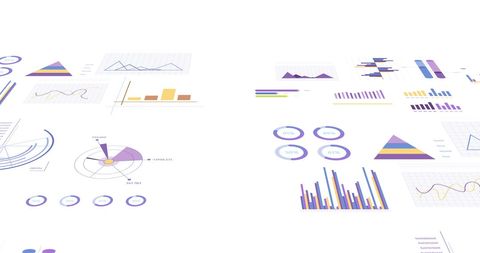
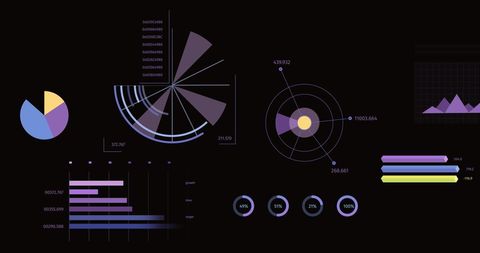
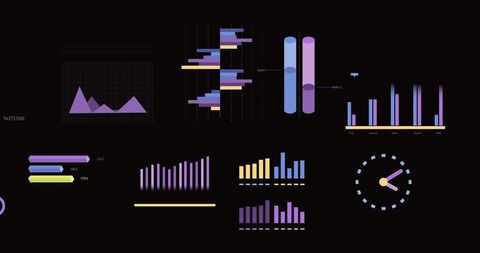
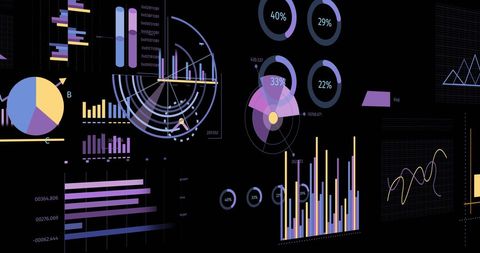
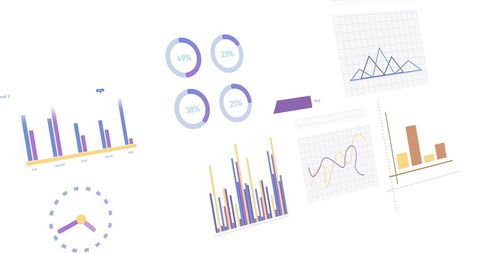
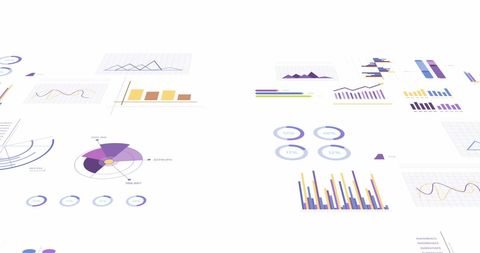
- Futuristic Financial Data Analytics Visual Concepts
Futuristic Financial Data Analytics Visual Concepts Image
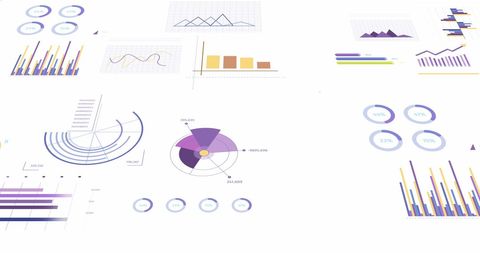
Visual represents innovative financial data concepts with various charts and graphs. Ideal for use in presentations and articles related to financial analytics, business intelligence, or digital technology. Useful for illustrating modern data processing and interface designs in financial services.
Powered by 


downloads
Tags:
More
Credit Photo
If you would like to credit the Photo, here are some ways you can do so
Text Link
photo Link
<span class="text-link">
<span>
<a target="_blank" href=https://pikwizard.com/photo/futuristic-financial-data-analytics-visual-concepts/933a76f534451aa9f92d94696543443e/>PikWizard</a>
</span>
</span>
<span class="image-link">
<span
style="margin: 0 0 20px 0; display: inline-block; vertical-align: middle; width: 100%;"
>
<a
target="_blank"
href="https://pikwizard.com/photo/futuristic-financial-data-analytics-visual-concepts/933a76f534451aa9f92d94696543443e/"
style="text-decoration: none; font-size: 10px; margin: 0;"
>
<img src="https://pikwizard.com/pw/medium/933a76f534451aa9f92d94696543443e.jpg" style="margin: 0; width: 100%;" alt="" />
<p style="font-size: 12px; margin: 0;">PikWizard</p>
</a>
</span>
</span>
Free (free of charge)
Free for personal and commercial use.
Author: Awesome Content
Similar Free Stock Images

Premium

Premium

Premium


Premium

Premium


Premium


Premium


Premium


Premium


Premium


Premium


Premium

Premium


Premium

Premium


Premium


Premium

Premium

Premium


Premium


Premium


Premium


Premium


Premium


Premium

Explore More Free Stock Images