
- Home >
- Stock Photos >
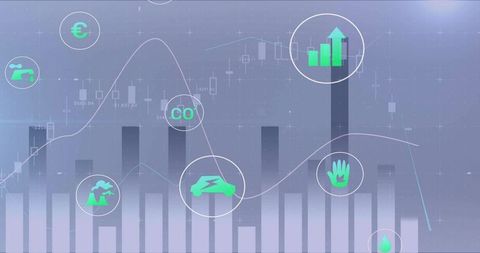
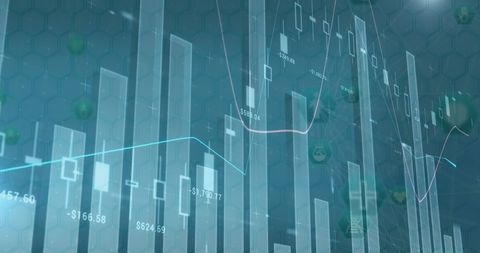
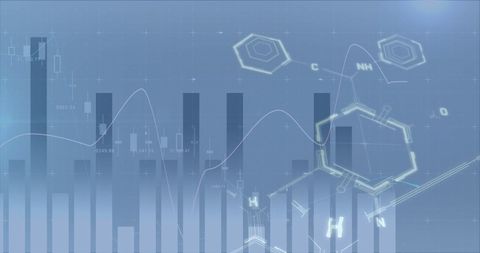
- Futuristic Financial Data Analytics with Bar Chart Background
Futuristic Financial Data Analytics with Bar Chart Background Image
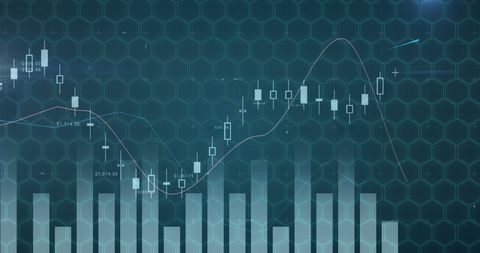
Abstract visual representation of financial data analytics with a bar chart overlay integrated within a hexagonal pattern on a blue background. Conveys advanced data processing and predictive insights in stock market and economic trend analysis. Effective for financial presentations, analytical studies, and economic forecasting materials.
Powered by 


downloads
Tags:
More
Credit Photo
If you would like to credit the Photo, here are some ways you can do so
Text Link
photo Link
<span class="text-link">
<span>
<a target="_blank" href=https://pikwizard.com/photo/futuristic-financial-data-analytics-with-bar-chart-background/aecb647c3e0d683d91706c9b36393f0e/>PikWizard</a>
</span>
</span>
<span class="image-link">
<span
style="margin: 0 0 20px 0; display: inline-block; vertical-align: middle; width: 100%;"
>
<a
target="_blank"
href="https://pikwizard.com/photo/futuristic-financial-data-analytics-with-bar-chart-background/aecb647c3e0d683d91706c9b36393f0e/"
style="text-decoration: none; font-size: 10px; margin: 0;"
>
<img src="https://pikwizard.com/pw/medium/aecb647c3e0d683d91706c9b36393f0e.jpg" style="margin: 0; width: 100%;" alt="" />
<p style="font-size: 12px; margin: 0;">PikWizard</p>
</a>
</span>
</span>
Free (free of charge)
Free for personal and commercial use.
Author: Authentic Images
Similar Free Stock Images

Premium

Premium
Premium


Premium


Premium


Premium


Premium


Premium


Premium

Premium

Premium


Premium


Premium

Premium


Premium


Premium

Premium

Premium


Premium

Premium


Premium

Premium


Premium


Premium


Premium

Explore More Free Stock Images