
- Home >
- Stock Photos >
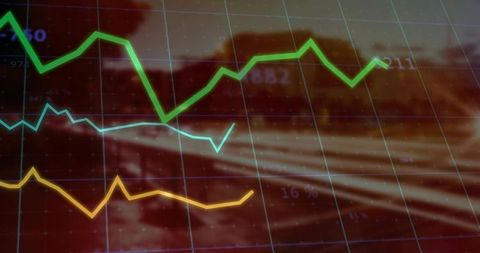
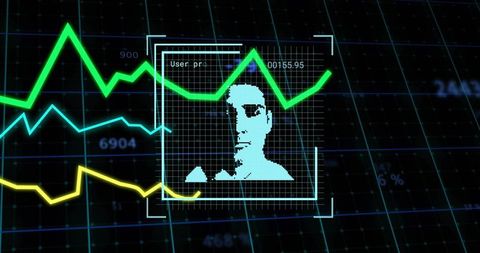
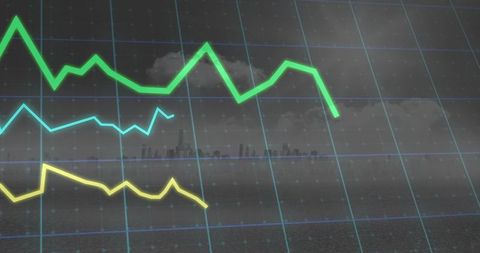
- Futuristic Financial Data Analytics with Particle Visualization
Futuristic Financial Data Analytics with Particle Visualization Image

Vibrant and dynamic representation of financial data analytics. Appropriate for use in financial reports, technology promotions, science and research articles, and educational presentations discussing economic trends. Overlay of numerical labels adds a realistic dimension for data visualization contexts, while the glowing particles suggest advanced technology and future prospects in data representation.
Powered by 


downloads
Tags:
More
Credit Photo
If you would like to credit the Photo, here are some ways you can do so
Text Link
photo Link
<span class="text-link">
<span>
<a target="_blank" href=https://pikwizard.com/photo/futuristic-financial-data-analytics-with-particle-visualization/9bb898a247638ca60fd2bfc81db274b5/>PikWizard</a>
</span>
</span>
<span class="image-link">
<span
style="margin: 0 0 20px 0; display: inline-block; vertical-align: middle; width: 100%;"
>
<a
target="_blank"
href="https://pikwizard.com/photo/futuristic-financial-data-analytics-with-particle-visualization/9bb898a247638ca60fd2bfc81db274b5/"
style="text-decoration: none; font-size: 10px; margin: 0;"
>
<img src="https://pikwizard.com/pw/medium/9bb898a247638ca60fd2bfc81db274b5.jpg" style="margin: 0; width: 100%;" alt="" />
<p style="font-size: 12px; margin: 0;">PikWizard</p>
</a>
</span>
</span>
Free (free of charge)
Free for personal and commercial use.
Author: Creative Art
Similar Free Stock Images

Premium


Premium

Premium


Premium


Premium


Premium


Premium


Premium


Premium

Premium

Premium

Premium


Premium


Premium


Premium

Premium

Premium


Premium


Premium


Premium

Premium


Premium


Premium


Premium


Premium


Explore More Free Stock Images