1. Home > 
  2. Stock Photos > 
  3. Futuristic Financial Data and Analytics Pathway

Futuristic Financial Data and Analytics Pathway Image

Futuristic Financial Data and Analytics Pathway

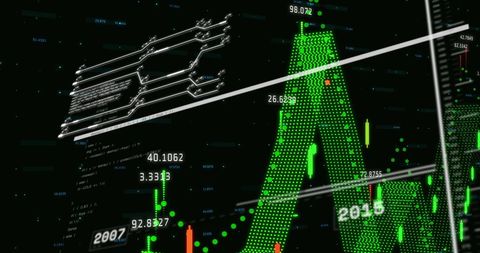
The visual acts as a modern representation of global finance, showcasing digital trends in the stock market and economic data analysis. The use of green dots and graph with a vivid segmented line highlights financial movement patterns. Useful for business presentations, tech brochures on finance, or educational materials related to stock analytics and investment trends.

Powered by Adobe logo
An analyst uses a computer and dashboard for data business analysis and Data Management System with KPI and metrics connected to the database for technology finance, operations, sales, marketing  - Powered by AdobeLaptop screen displaying financial data charts. - Powered by AdobeA robotic hand interacting with a glowing holographic bar chart emerging from a digital tablet, symbolizing AI-driven data analysis, business intelligence, and futuristic technology. - Powered by AdobeBusiness finance data analytics graph.Financial management technology.Advisor using KPI Dashboard on virtual screen. - Powered by AdobeArrow hits digital target bullseye. Futuristic tech design, represents success, achievement. Precision, accuracy, strategy, goal visualization, data, information, aim. Technology, business, - Powered by Adobe

Credit Photo

If you would like to credit the Photo, here are some ways you can do so

Free (free of charge)

Free for personal and commercial use.

Author: Creative Art

Similar Free Stock Images

Digital Stock Market Graph with Dynamic Data Displays
Premium
A corporate data management expert analyzing real-time financial and business data on a large digital screen, showcasing market trends, analytics, and strategic insights in a modern office
3D Stock Market Graph in Digital Display
Digital Financial Data Visualization with Office Background
Digital Financial Data Analysis with Graphs
Futuristic Global Financial Data Analysis Background
Premium
Data analytics and big data strategy for real-time analytics, predictive data modeling, business intelligence analytics, and data-driven decision-making in modern digital businesses. Thunk
Finance Data Learning: Economic Trends and Market Analysis
Abstract Financial Data with Neon Line Graph and Candlestick Chart
Advanced Digital Graph Illustrating Stock Market Trends
Global Financial Data Overlay with Vibrant Graphs on World Map
Premium
Hand holding magnifying glass over glowing digital financial chart with data analysis and growth trends on dark background
Digital Data Infographic Detail with Data Points and Graphs
Digital Financial Data Display in Modern Server Room
Concept of Financial Data Analysis with Digital Elements
Abstract Data Analytics with Futuristic Interface Design
Premium
Professional woman analyzing data on a curved monitor. Charts and graphs display performance, strategy, and financial insights. Great for business  tech.
Digital Financial Graph and City Silhouette Backdrop
Global Business Dashboard Overlay on Urban Skyline Background
Digital Data Chart on Grey Background with Red Trend Line
Futuristic Digital Data Graphs and World Map
Premium
Businessman use AI technology data analysis for business to enhance risk management and improve financial forecasting.
Dynamic Financial Data Processing Over Skyscrapers
Abstract Financial Data Streams Over Cityscape Background
Global Financial Data on Virtual Screen Displaying Stock Market Trends
Financial Data Overlaid on Server Room Showing Business Growth
Premium
Finance analyst working on business analytics and data management system to make financial report with business performance, KPI dashboard. Corporate strategy for finance, digital marketing plan
Futuristic Financial Data Chart with Virtual Interface
Financial Data Analytics with Digital Visualization Concept
Businessman Analyzing Financial Data with Graphs in Office
Financial Trading Chart Overlaying World Map with Red Trend Line
Colorful Stock Market Graph with LED Display Style
Colorful Financial Graph with Global Map Display
Premium
Data science and big data technology. Data scientist computing, analysing and visualizing complex data set on computer. Data mining, artificial intelligence, machine learning, business analytics.
Digital Financial Data Overlayed on Office Scene
Digital Green Financial Markets with Cryptocurrency Trends
Dynamic Financial Data Elements on Abstarct Grid
Futuristic Digital Data Analytics Visual Interface
Premium
A silhouette of a man in a suit against a vibrant city skyline, overlaid with colorful financial graphs, depicting a sense of analytics and business growth.
Dynamic Financial Data with Abstract Stock Market Graphs
Dynamic Digital Graph Overlay on World Map Illustrating Global Market Trends
Abstract Financial Data and Stock Market Trading Concept
Colorful Digital Financial Analytics Interface for Data Visualization
Premium
A business professional analyzing futuristic digital graphs and analytics dashboards on a tablet, showcasing data visualization, financial growth, and business intelligence in a modern tech environmen
Construction Site Merging with Financial Data Stream
Digital Interface Showing Data Protection and Financial Trends
Financial Data and Blood Vessels Fusion Exploring Adaptive Business Intelligence
Dynamic Digital Market Analysis with Holographic Data
Premium
Business strategy analysis data, Analyst database development analytic. Business, Analytics and Data Management System on computer, make report KPI and metrics connected database
Abstract Financial Data Processing Visualization in Digital Environment
Global Financial Data Overlay on Digital World Map
Holographic Financial Graphs and Data Representation
Financial Data Visualization with Infographics and Graphs
Premium
Analyst working with computer in Business Analytics and Data Management System  with KPI and metrics connected to the database for technology finance, operations, sales, marketing. Data analysis.Ai
Advanced Financial Data Network Over World Map
Social Media Alerts Overlaying Financial Market Trends
Financial Data Processing Code Over Digital Graph
Digital Data Visualization on Futuristic Network Servers
Premium
An Analyst uses a computer and dashboard for data business analysis and Data Management System with KPI to report. Database for technology finance, operations, sales, marketing and SEO
Financial Data Analysis with Graphs on Grey Background
Digital Stock Market Data with Upward Trend Graph
Analytical Dashboard with Candlestick Chart and Dotted Trend Line
Colorful Digital Stock Market Graph on Grid Background
Dynamic Stock Market Analysis Concept Chart
Colorful Digital Graph on World Map Depict Economic Trends
Premium

Dynamic blue and green digital stock market graph with bar charts and lines on a dark background, representing financial data analysis, investment trends, business growth, and global economy fluctuat
Digital Financial Data on Black Background with Graphs
Digital Financial Graph with Dynamic Trading Analysis
Digital Financial Graphs and Data in Motion
Futuristic Data Analysis with Chart and Digital Graphics
Premium
Business finance data analytics graph.Financial management technology.Advisor using KPI Dashboard on virtual screen.
Abstract Purple Wave Pattern Over Digital Stock Market Display
Digital Display of Inflation Concept Over Financial Trends Chart
Dynamic Financial Data Analysis with Illuminated Graphs
Digital Data Processing with Friends and Bicycles Concept
Premium
Data analytics and graphs. Analysis of statistical business marketing data. Data scientist using laptop computer to analyze data.
Futuristic Financial Data Analysis with Dynamic Charts and Graphs
Economic Growth Chart Over Urban Cityscape with Digital Interface
Digital Financial Data Visualization with Graphs and Charts
Abstract Financial Data Chart Over Urban Skyline
Premium
Business team analyzing charts on a large screen during meeting
Colorful Financial Data Analytics and Global Market Trends
Dynamic Financial Data on Orange Background
Futuristic Data Visualization with Rising Graphs on Orange Background
Digital Financial Statistics and Data Over Dark Background
Premium
Business meeting, data analytics or women with graph presentation in office for tablet, idea or laptop collaboration. Chart, analysis or accounting team brainstorming economy, inflation or solution
Abstract Financial Graphs with Candlestick Chart Indicators
Digital Financial Data and Graph Display with Codes
Financial Market Data Visualization with Global Chart Overlay
Data Processing and Analytics on Global Finance Map
Premium
Business people analyze data and big data technology Two businessmen calculate business analysis and display images of complex data sets on a computer on the screen. artificial intelligence
Global Data Visualization on Digital Interface Background
Futuristic Financial Dashboard Showing Candlestick Trends, Dotted Ribbon Path and Alerts
Global Stock Market Data Over World Map with Neon Graphics
Abstract Stock Market Data Visualization
Dynamic Global Financial Data Representation
Futuristic Digital Interface with Market Analysis
Premium
Financial market data analysis with glowing 3D bar and line charts on dark background showing economic trends and growth concept visualization. 3D Rendering
Abstract Financial Stock Market Data Interface
Abstract Digital Interface with Glowing Data Metrics
Digital Data Processing with Graphs and Coding Visualization
Colorful Graph Representing Global Economy Stock Market Movement
Premium
Analyst working in Business Analytics and Data Management System to make report with KPI and metrics connected to database. Corporate strategy for finance, operations, sales, marketing.
Global Business Data Analytics on World Map
Abstract Digital Market Analysis with Financial Charts
Financial Data Visualization Over Construction Site
Digital Financial Data Technicolor Motion Chart
Premium
Business man in formal suit points chart data on digital interactive whiteboard screen during business presentation meeting. Speaker explains financial market analytics. Modern business conference
Digital Interface with Data Graphs and Charts on Blue Background
Digital Stock Market Graph with Neon Cyan and Purple Elements
Visualizing Financial Data Trends Over Urban Backdrop
Digital Interface with Financial Data Visualizations
Premium
Business professionals collaborating and analyzing financial data on a laptop with charts and graphs during a meeting
Digital Data Flow Over Financial Cityscape
Abstract Financial Data Concepts over Cityscape
Futuristic Financial Data Display Over Cityscape
Global Business Finance Data Analysis Visualization
Premium
Trade business analytics graph and financial chart investment. Stock market investment trading graph and crypto currency.
Futuristic Data Processing with Bright Visual Graphs
Dynamic Digital Data Analysis in Finance
Digital Data Processing with Code and Graphs on Black Background
Abstract Digital Data Visualization and Analysis Background
Premium
Businesswoman typing on laptop with digital financial chart overlay, representing data analysis, stock market trends, economic growth, investment, business strategy, and modern technology.
Neon Candlestick Chart Featuring Moving Averages, Segmented Trendline and Delta Labels on Trading UI