
- Home >
- Stock Photos >
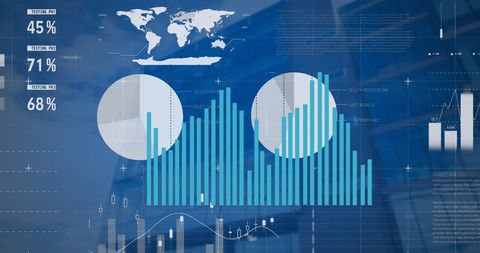
- Futuristic Financial Data and Analytics Visualization
Futuristic Financial Data and Analytics Visualization Image

This digital depiction of financial data processing showcases a blend of civilization's commitment to technology-driven progresses in business analytics. Adept for illustrating concepts in global finance, technology's role in business, or innovative data processing solutions. Perfect for use in presentations, articles and marketing material revolving around topics of financial technology, strategic business developments and futuristic digital solutions.
Powered by 


downloads
Tags:
More
Credit Photo
If you would like to credit the Photo, here are some ways you can do so
Text Link
photo Link
<span class="text-link">
<span>
<a target="_blank" href=https://pikwizard.com/photo/futuristic-financial-data-and-analytics-visualization/68c13745527c1cd113e388dc4dd066ee/>PikWizard</a>
</span>
</span>
<span class="image-link">
<span
style="margin: 0 0 20px 0; display: inline-block; vertical-align: middle; width: 100%;"
>
<a
target="_blank"
href="https://pikwizard.com/photo/futuristic-financial-data-and-analytics-visualization/68c13745527c1cd113e388dc4dd066ee/"
style="text-decoration: none; font-size: 10px; margin: 0;"
>
<img src="https://pikwizard.com/pw/medium/68c13745527c1cd113e388dc4dd066ee.jpg" style="margin: 0; width: 100%;" alt="" />
<p style="font-size: 12px; margin: 0;">PikWizard</p>
</a>
</span>
</span>
Free (free of charge)
Free for personal and commercial use.
Author: People Creations
Similar Free Stock Images

Premium


Premium


Premium


Premium


Premium

Premium


Premium


Premium


Premium


Premium


Premium


Premium


Premium

Premium


Premium

Premium


Premium


Premium


Premium


Premium

Premium


Premium


Premium


Premium


Premium


Explore More Free Stock Images