
- Home >
- Stock Photos >
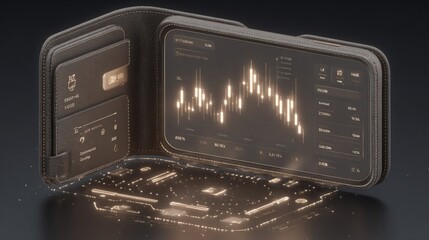
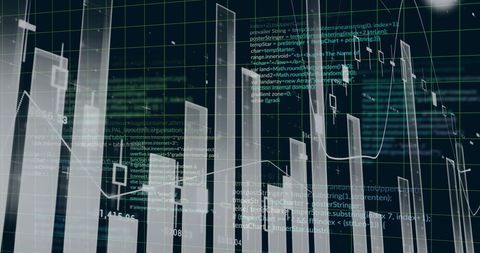
- Futuristic Financial Data and Graphs on Digital Interface
Futuristic Financial Data and Graphs on Digital Interface Image

This representation of financial data and graphs on a digital interface is ideal for visualizing modern trading and investment themes. It can be used in business presentations, financial reports, websites focusing on technology in the financial sector, or educational materials related to stock markets and economic analysis.
Powered by 


downloads
Tags:
More
Credit Photo
If you would like to credit the Photo, here are some ways you can do so
Text Link
photo Link
<span class="text-link">
<span>
<a target="_blank" href=https://pikwizard.com/photo/futuristic-financial-data-and-graphs-on-digital-interface/244cc1979d3bb6ab490b0c3df7b09b7c/>PikWizard</a>
</span>
</span>
<span class="image-link">
<span
style="margin: 0 0 20px 0; display: inline-block; vertical-align: middle; width: 100%;"
>
<a
target="_blank"
href="https://pikwizard.com/photo/futuristic-financial-data-and-graphs-on-digital-interface/244cc1979d3bb6ab490b0c3df7b09b7c/"
style="text-decoration: none; font-size: 10px; margin: 0;"
>
<img src="https://pikwizard.com/pw/medium/244cc1979d3bb6ab490b0c3df7b09b7c.jpg" style="margin: 0; width: 100%;" alt="" />
<p style="font-size: 12px; margin: 0;">PikWizard</p>
</a>
</span>
</span>
Free (free of charge)
Free for personal and commercial use.
Author: Authentic Images
Similar Free Stock Images

Premium

Premium

Premium


Premium

Premium


Premium


Premium


Premium

Premium

Premium

Premium


Premium

Premium


Premium


Premium


Premium


Premium


Premium


Premium


Premium


Premium


Premium


Premium


Premium


Premium

Explore More Free Stock Images