
- Home >
- Stock Photos >
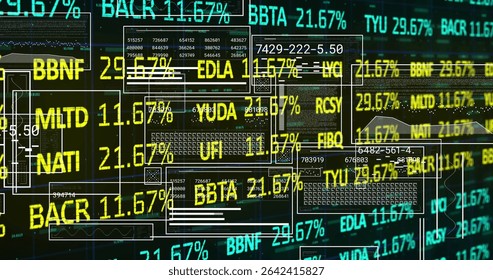
- Futuristic Financial Data Chart with Virtual Interface
Futuristic Financial Data Chart with Virtual Interface Image

Depicting fluctuating graph lines overlaid with digital numbers and patterns, this conveys a sense of advanced data analysis and business intelligence. Ideal for illustrating concepts related to finance, stock markets, global business strategies, and digital technology trends.
Powered by  - Get 15% off with code: PIKWIZARD15


downloads
Tags:
More
Credit Photo
If you would like to credit the Photo, here are some ways you can do so
Text Link
photo Link
<span class="text-link">
<span>
<a target="_blank" href=https://pikwizard.com/photo/futuristic-financial-data-chart-with-virtual-interface/d4cf568eb380dc492f99c4805bad5ea2/>PikWizard</a>
</span>
</span>
<span class="image-link">
<span
style="margin: 0 0 20px 0; display: inline-block; vertical-align: middle; width: 100%;"
>
<a
target="_blank"
href="https://pikwizard.com/photo/futuristic-financial-data-chart-with-virtual-interface/d4cf568eb380dc492f99c4805bad5ea2/"
style="text-decoration: none; font-size: 10px; margin: 0;"
>
<img src="https://pikwizard.com/pw/medium/d4cf568eb380dc492f99c4805bad5ea2.jpg" style="margin: 0; width: 100%;" alt="" />
<p style="font-size: 12px; margin: 0;">PikWizard</p>
</a>
</span>
</span>
Free (free of charge)
Free for personal and commercial use.
Author: People Creations
Similar Free Stock Images

Premium


Premium

Premium

Premium


Premium


Premium


Premium


Premium


Premium


Premium


Premium


Premium


Premium


AI


Premium

Premium


Premium


Premium


Premium

Premium


Premium

Premium


Premium


Premium


Premium

Premium

Explore More Free Stock Images