- Home >
- Stock Photos >
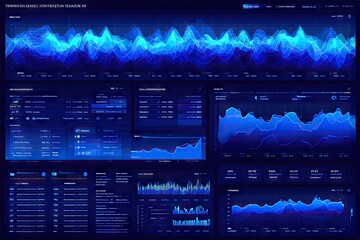
- Futuristic Financial Data Dashboard Showing Neon Market Trends, Percent Growth, Analytics
Futuristic Financial Data Dashboard Showing Neon Market Trends, Percent Growth, Analytics Image

Depicting market performance with neon blue and magenta trend lines, dotted histogram bars, percentage annotations, and grid overlay. Creating futuristic, high-tech mood with subtle lens flare and soft bokeh highlights. Providing versatile visual for fintech branding, investor reports, trading platform interfaces, corporate slide decks, and marketing campaigns. Working well as hero banner, slide background, article header, ad creative backdrop, or infographic element. Emphasizing data-driven storytelling, performance metrics, and growth trends for business presentations, pitch decks, financial websites, and social media promotions.
Powered by 


0
downloads
downloads
Tags:
More
Credit Photo
If you would like to credit the Photo, here are some ways you can do so
Text Link
photo Link
<span class="text-link">
<span>
<a target="_blank" href=https://pikwizard.com/photo/futuristic-financial-data-dashboard-showing-neon-market-trends-percent-growth-analytics/997ef9537d8cbe754f1e1eb9114bae39/>PikWizard</a>
</span>
</span>
<span class="image-link">
<span
style="margin: 0 0 20px 0; display: inline-block; vertical-align: middle; width: 100%;"
>
<a
target="_blank"
href="https://pikwizard.com/photo/futuristic-financial-data-dashboard-showing-neon-market-trends-percent-growth-analytics/997ef9537d8cbe754f1e1eb9114bae39/"
style="text-decoration: none; font-size: 10px; margin: 0;"
>
<img src="https://pikwizard.com/pw/medium/997ef9537d8cbe754f1e1eb9114bae39.jpg" style="margin: 0; width: 100%;" alt="" />
<p style="font-size: 12px; margin: 0;">PikWizard</p>
</a>
</span>
</span>
Free (free of charge)
Free for personal and commercial use.
Author: People Creations
Similar Free Stock Images
Loading...

Premium


Premium
Premium

Premium


Premium


Premium

Premium

Premium


Premium

Premium


Premium


Premium


Premium


Premium


Premium


Premium


Premium


Premium


Premium


Premium


Premium


Premium


Premium


Premium


Premium