- Home >
- Stock Photos >
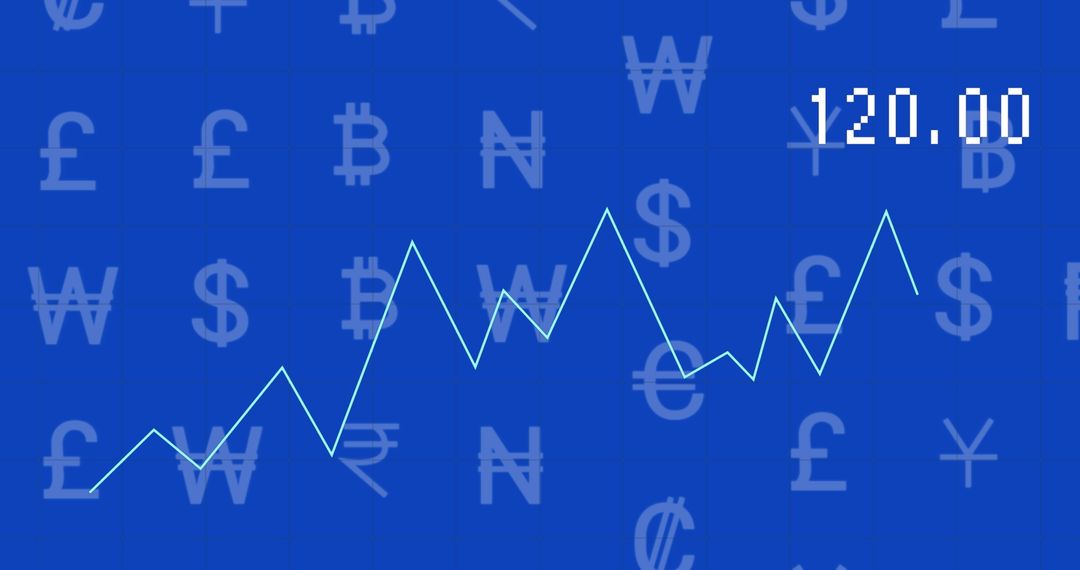
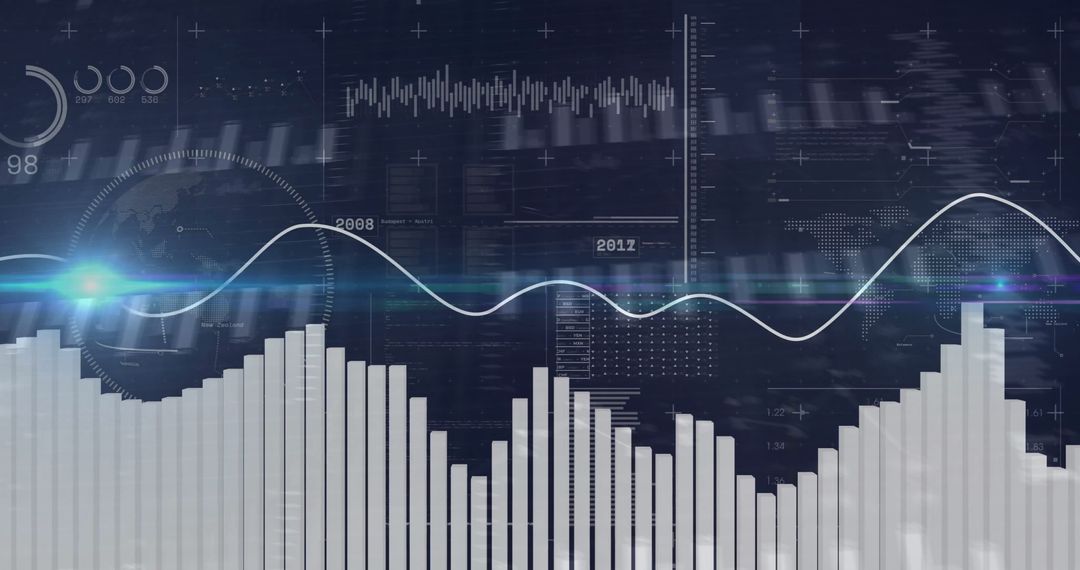
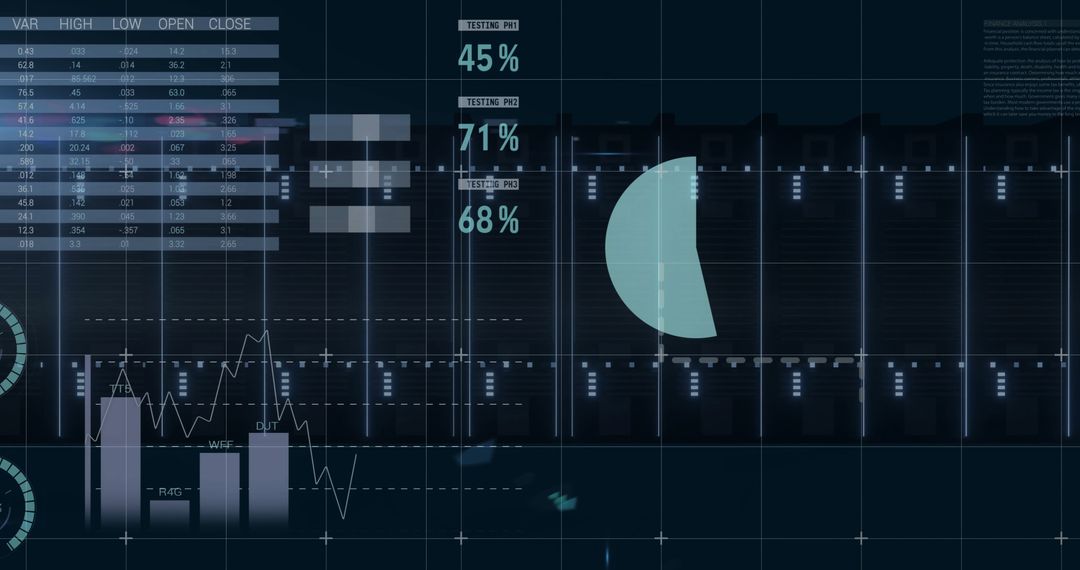
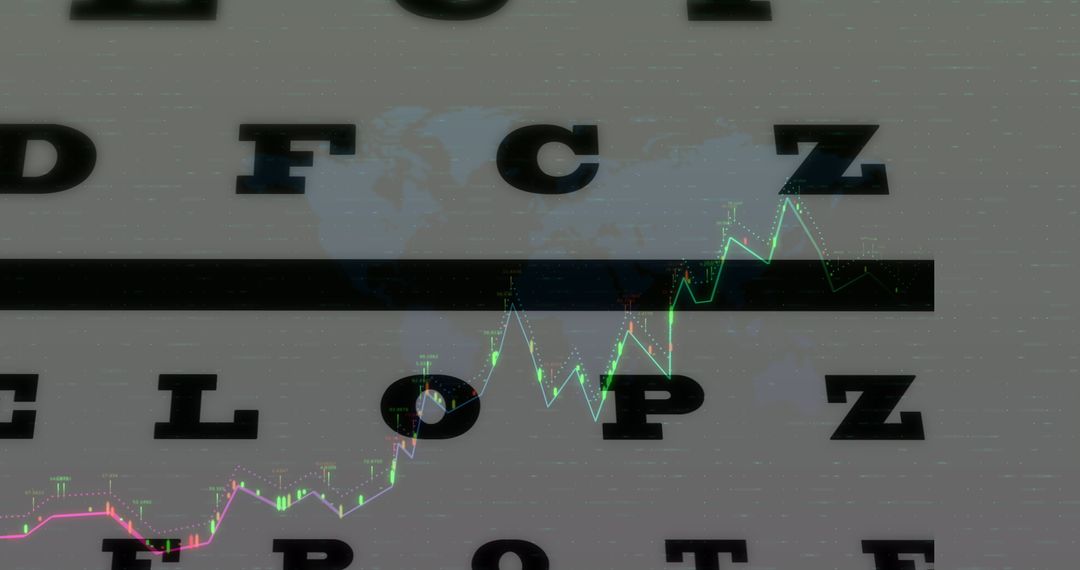
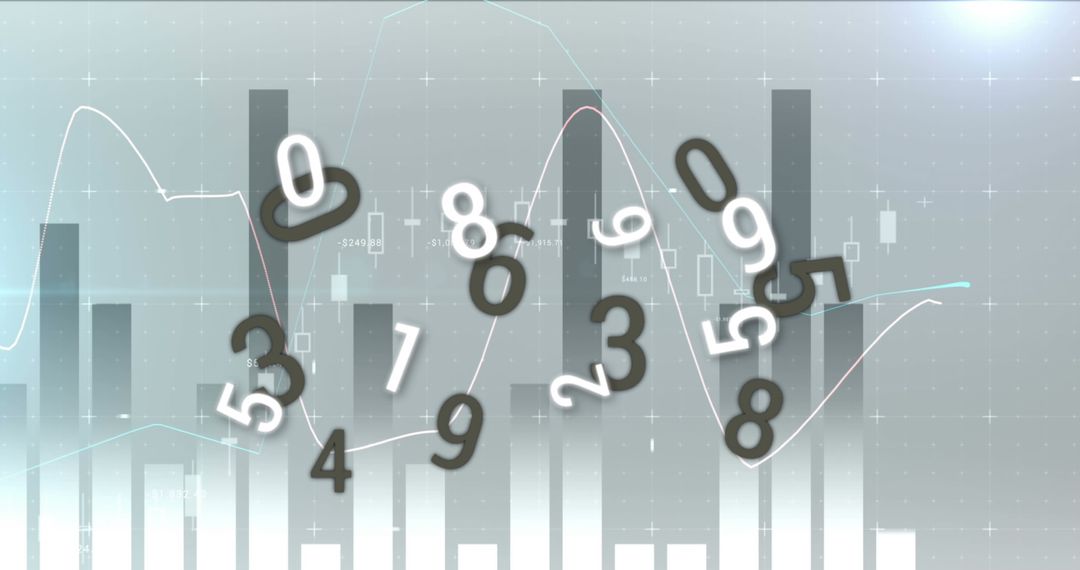
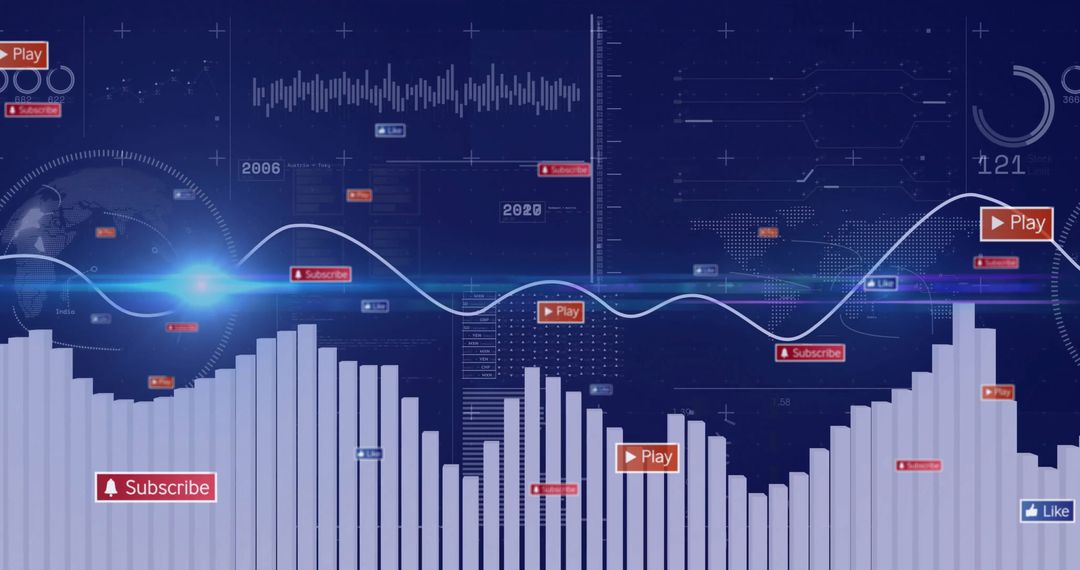
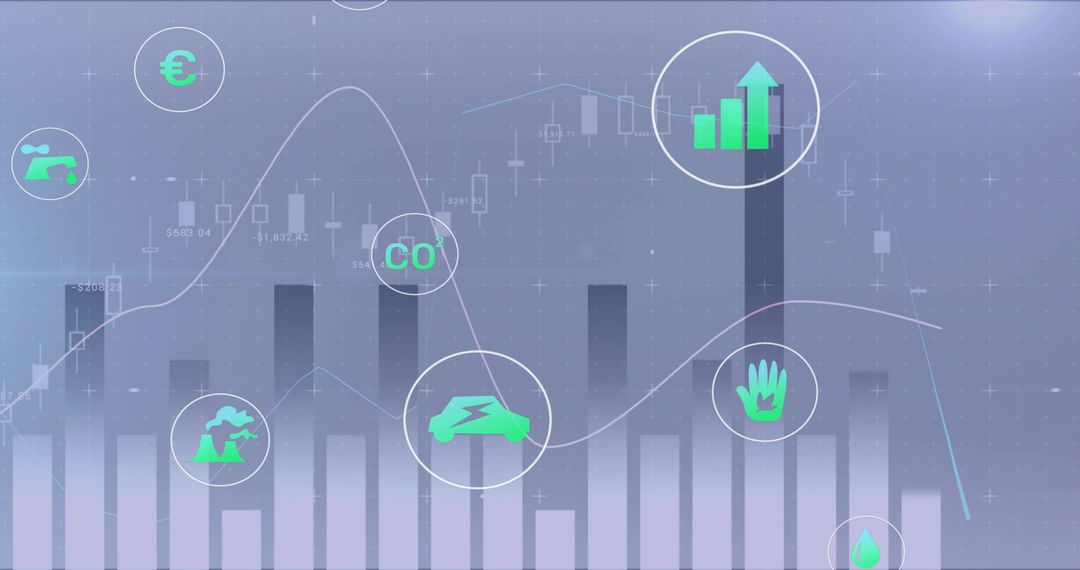
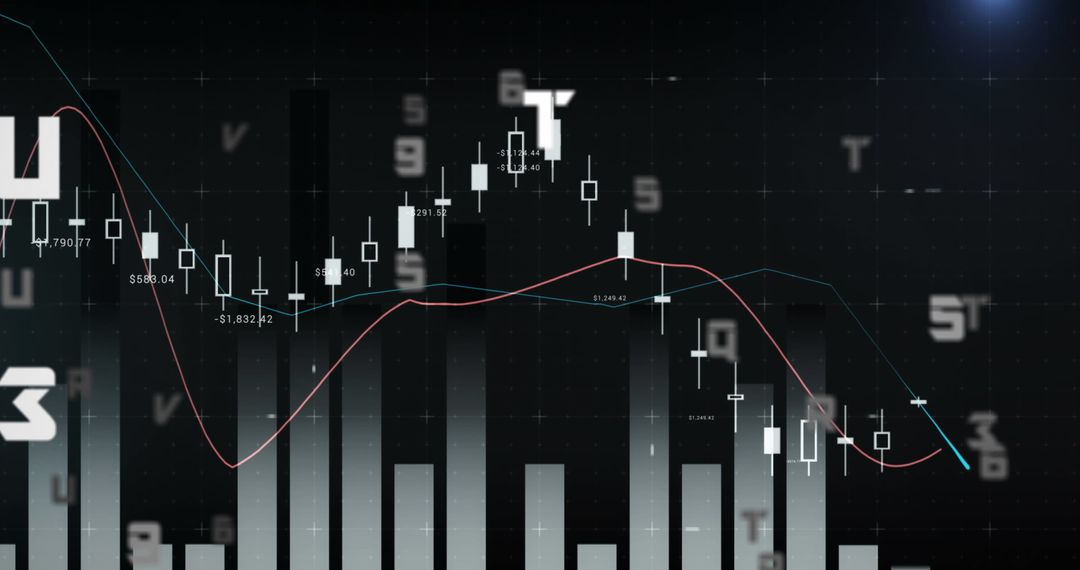
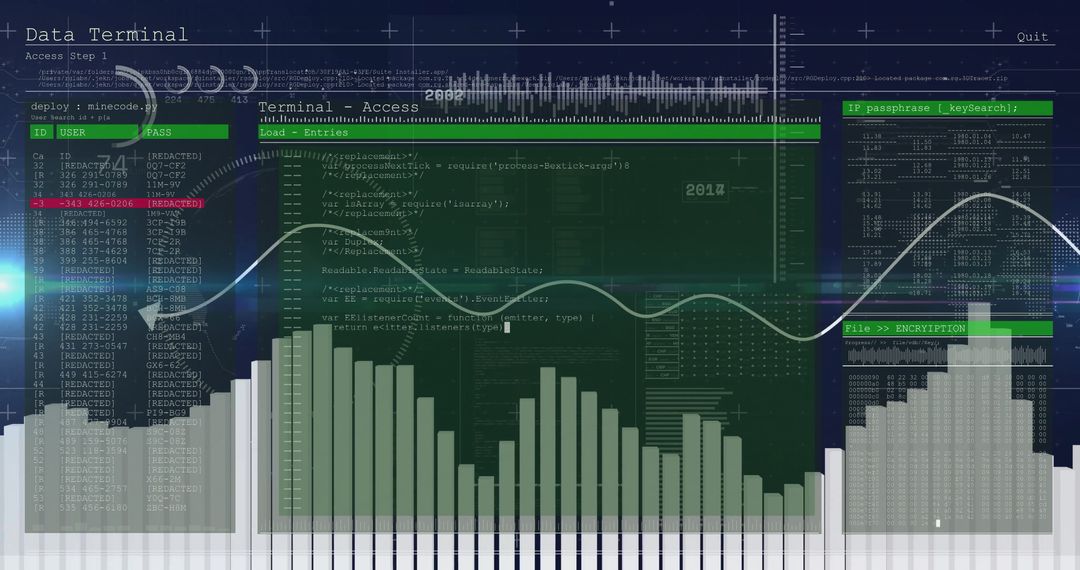
- Futuristic Financial Data Dashboard with Currency Overlay
Futuristic Financial Data Dashboard with Currency Overlay Image

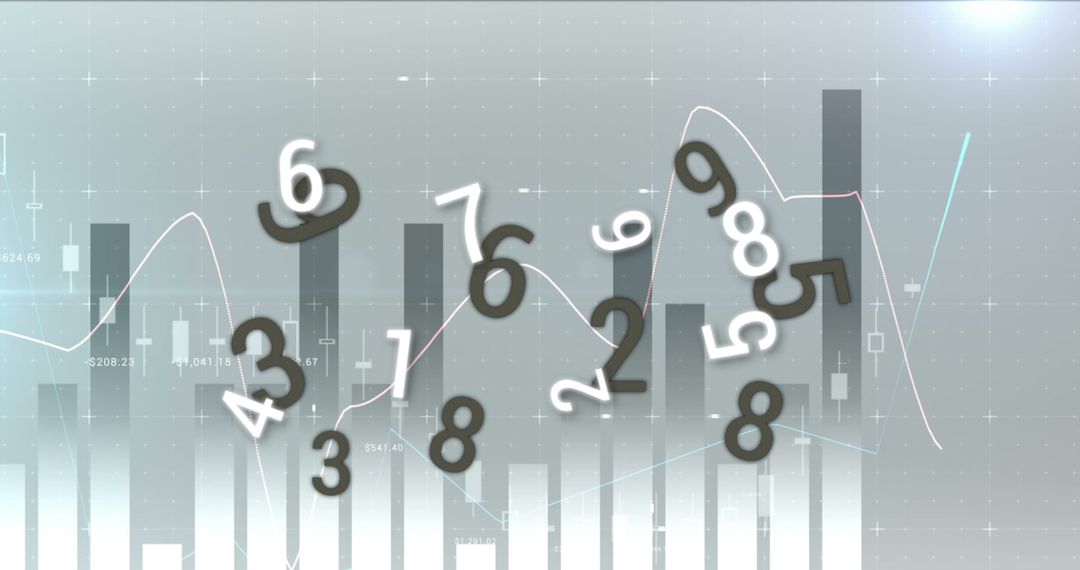
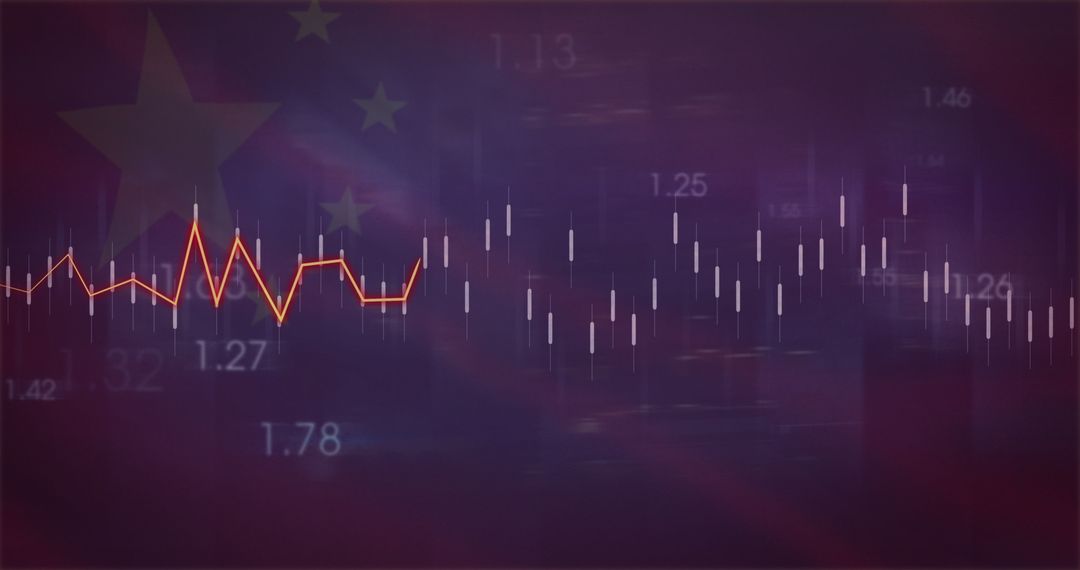
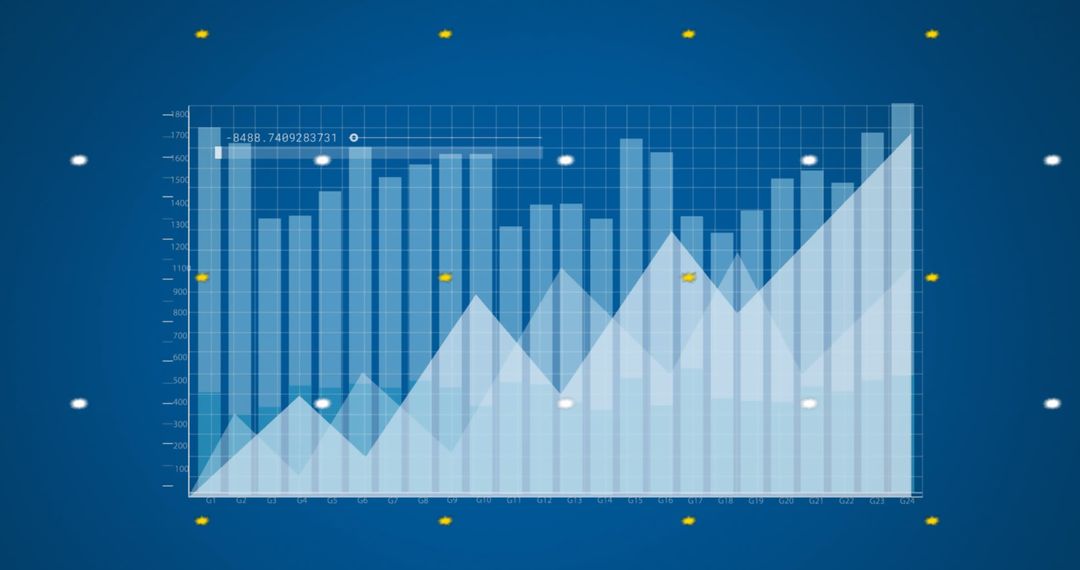
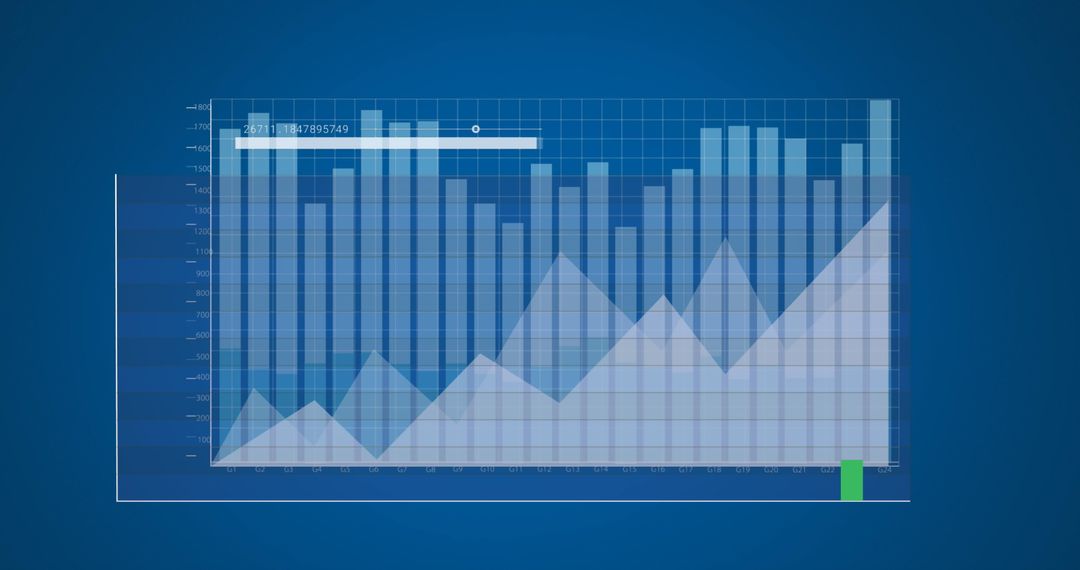
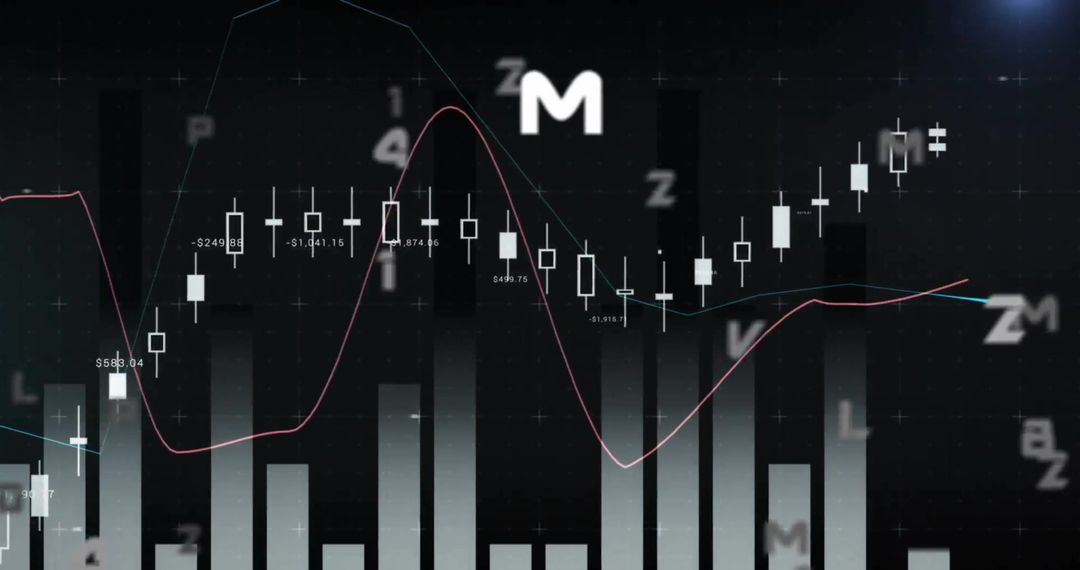
Visualizing financial data with focus on global currencies and metrics. Ideal for illustrating investment reports, economic forecasting, and financial tech solutions. Visually represents technology-driven finance strategies chart. Suitable for presentations on global market trends and digital investment tools.
Powered by  - Get 15% off with code: PIKWIZARD15


2
downloads
downloads
Tags:
More
Credit Photo
If you would like to credit the Photo, here are some ways you can do so
Text Link
photo Link
<span class="text-link">
<span>
<a target="_blank" href=https://pikwizard.com/photo/futuristic-financial-data-dashboard-with-currency-overlay/d141652c3f277b2ffd810e6ca3c1e816/>PikWizard</a>
</span>
</span>
<span class="image-link">
<span
style="margin: 0 0 20px 0; display: inline-block; vertical-align: middle; width: 100%;"
>
<a
target="_blank"
href="https://pikwizard.com/photo/futuristic-financial-data-dashboard-with-currency-overlay/d141652c3f277b2ffd810e6ca3c1e816/"
style="text-decoration: none; font-size: 10px; margin: 0;"
>
<img src="https://pikwizard.com/pw/medium/d141652c3f277b2ffd810e6ca3c1e816.jpg" style="margin: 0; width: 100%;" alt="" />
<p style="font-size: 12px; margin: 0;">PikWizard</p>
</a>
</span>
</span>
Free (free of charge)
Free for personal and commercial use.
Author: Creative Art
Similar Free Stock Images
Premium


Premium


Premium


Premium


Premium


Premium


Premium


Premium


Premium


Premium


Premium


Premium


Premium


Premium


Premium


Premium


Premium


Premium


Premium


Premium


Premium


Premium


Premium


Premium