- Home >
- Stock Photos >
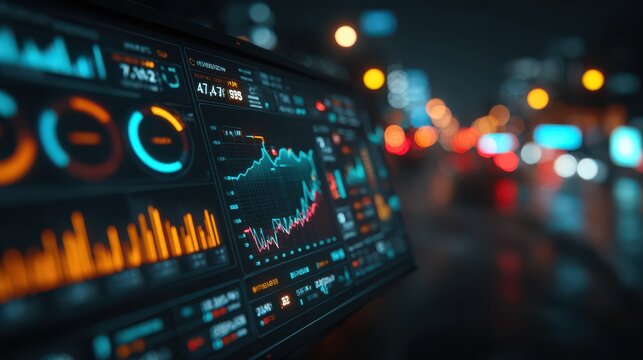
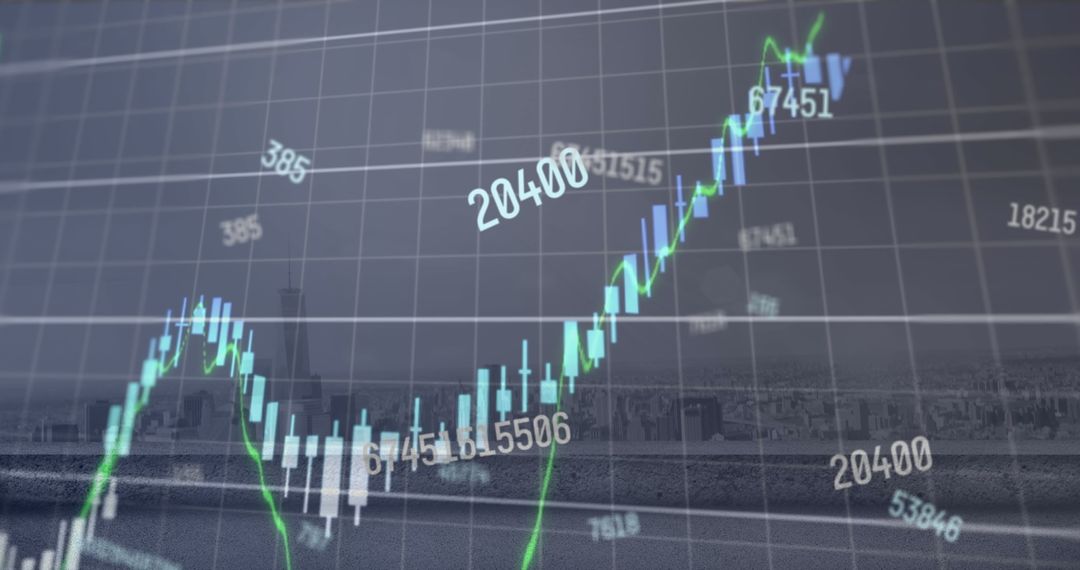
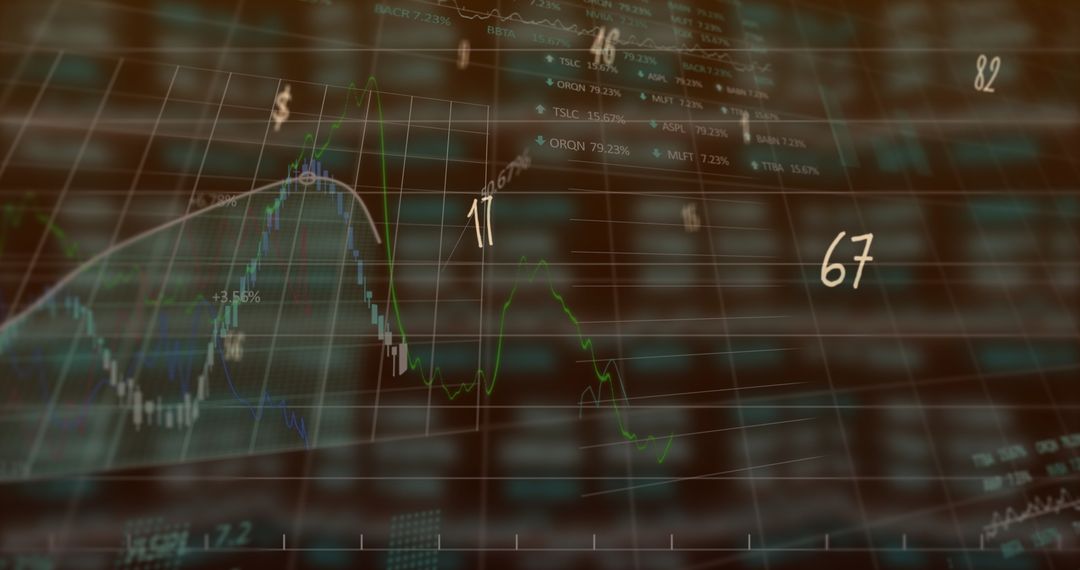
- Futuristic Financial Data Display with Charts and Graphs
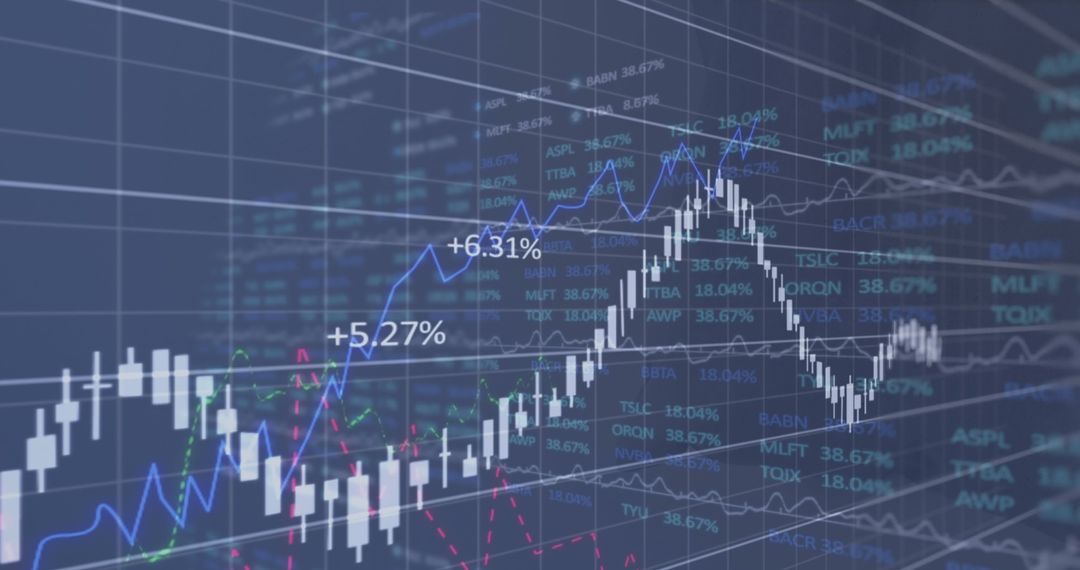
Futuristic Financial Data Display with Charts and Graphs Image

Illuminated charts and graphs illustrate advanced financial data processing on dark background, symbolic of global economic activity. Ideal for content related to finance, technology innovations in economics and stock market analysis highlights. Useful for websites, presentations, and articles focusing on financial trends, data analytics, and economic forecasters.
Powered by 


2
downloads
downloads
Tags:
More
Credit Photo
If you would like to credit the Photo, here are some ways you can do so
Text Link
photo Link
<span class="text-link">
<span>
<a target="_blank" href=https://pikwizard.com/photo/futuristic-financial-data-display-with-charts-and-graphs/3038dff65a7c26df5de018b5f465af1b/>PikWizard</a>
</span>
</span>
<span class="image-link">
<span
style="margin: 0 0 20px 0; display: inline-block; vertical-align: middle; width: 100%;"
>
<a
target="_blank"
href="https://pikwizard.com/photo/futuristic-financial-data-display-with-charts-and-graphs/3038dff65a7c26df5de018b5f465af1b/"
style="text-decoration: none; font-size: 10px; margin: 0;"
>
<img src="https://pikwizard.com/pw/medium/3038dff65a7c26df5de018b5f465af1b.jpg" style="margin: 0; width: 100%;" alt="" />
<p style="font-size: 12px; margin: 0;">PikWizard</p>
</a>
</span>
</span>
Free (free of charge)
Free for personal and commercial use.
Author: Authentic Images
Similar Free Stock Images

Premium


Premium


Premium


Premium


Premium


Premium


Premium


Premium


Premium


Premium


Premium


Premium


Premium


Premium


Premium


Premium


Premium


Premium


Premium


Premium


Premium


Premium


Premium


Premium